VOGONS


Reply 260 of 299, by nd22

User metadata
Rank Oldbie
Rank
Oldbie

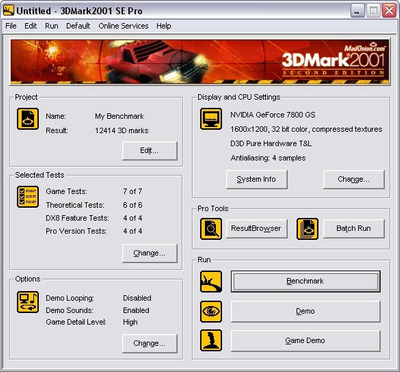
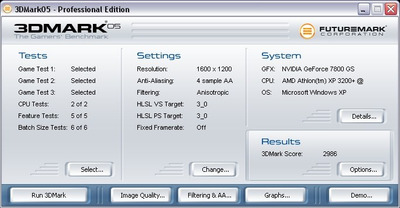
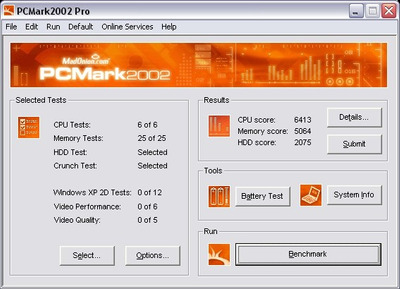
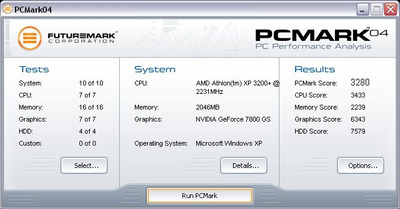
KT600 is again defeated by its newer brother but this is not a huge problem; the problem is the fact it is also defeated by nforce2 which is a bigger problem for VIA:
nforce2: 14351 - 100%
KT880: 13749 - 95.80%
KT600: 13392 - 93.31%

Reply 261 of 299, by nd22

User metadata
Rank Oldbie
Rank
Oldbie

We have reached the final and most challenging test done at 1600*1200:

Attachments

Reply 262 of 299, by nd22

User metadata
Rank Oldbie
Rank
Oldbie

The results at this extreme settings are too close to declare a victory for any of the 3 chipsets:
nforce2: 12563 - 100%
KT880: 12240 - 97.42%
KT600: 12414 - 98.81%
Despite the fact that the results at 1600*1200 are not conclusive, I think that based on the results at 1280*1024 and 1024*768 nforce2 has established itself as the victor in 3dmark 2001!

Reply 264 of 299, by nd22

User metadata
Rank Oldbie
Rank
Oldbie

I do not think that KT600 is better than KT880! 1-2% better in tests is within the margin of error IMHO. You will see later that there is a problem with KT600, but let's not anticipate for now! Audio wise VT1616 codec is miles ahead of ALC650 and that is a big difference in all tests that include sound!

Reply 265 of 299, by nd22

User metadata
Rank Oldbie
Rank
Oldbie

We are now going to test 3dmark 2003, a DirectX9 benchmark.
First is 1024*768 resolution!

Attachments

Reply 269 of 299, by nd22

User metadata
Rank Oldbie
Rank
Oldbie

And finally the big daddy: 1600*1200 resolution!

Attachments

Reply 270 of 299, by nd22

User metadata
Rank Oldbie
Rank
Oldbie

Again the results are incredibly close!
nforce2: 4154 - 100%
KT880: 4189 - 100.84%
KT600: 4225 - 101.70%
3dmark 2003 does not have a winner! All 3 platforms perform really close and geforce 7800gs is already starting to be the limiting factor beyond 1024*768!

Reply 271 of 299, by nd22

User metadata
Rank Oldbie
Rank
Oldbie

We have now reached the final 3dmark: 2005! Heavily dependent on the video card, let's see if the KT600 can make up for earlier losses!
1024*768 default settings:

Attachments

Reply 272 of 299, by nd22

User metadata
Rank Oldbie
Rank
Oldbie

The results are pretty close; nforce2 has a very small advantage - within the margin of error:
nforce2: 5449 - 100%
KT880: 5376 - 98.66%
KT600: 5310 - 97.44%

Reply 273 of 299, by nd22

User metadata
Rank Oldbie
Rank
Oldbie

We increase the resolution to 1280*1024:

Attachments

Reply 275 of 299, by nd22

User metadata
Rank Oldbie
Rank
Oldbie

And the final 3dmark 2005 test, at 1600*1200:

Attachments

Reply 276 of 299, by nd22

User metadata
Rank Oldbie
Rank
Oldbie

By now it is clear that 3dmark 2005 is too much for geforce 7800gs; that raises the question: how could Tom and Anand declare geforce 6800 ultra or radeon X850 XT PE as "extreme gamers cards" that "offers smoother playability" to their owners in Battlefield 2, Quake 4 and so on if a stronger card has serious problems in previous year games such as Doom 3 and Half life 2 at max settings and also in synthetic benchmarks!
nforce2: 2977 - 100%
KT880: 2974 - 99.89%
KT600: 2986 - 100.30

Reply 277 of 299, by nd22

User metadata
Rank Oldbie
Rank
Oldbie

We are finished with 3dmark and now we test PC Mark version 2002:

Attachments

Reply 278 of 299, by nd22

User metadata
Rank Oldbie
Rank
Oldbie

We are not interested in the overall score but in individuals scores:
CPU scores are extremely close:
nforce2: 6402 - 100%
KT880: 6345 - 99.10%
KT600: 6413 - 100.17%
RAM
nforce2: 6264 - 100%
KT880: 5883 - 93.91%
KT600: 5064 - 80.84%
The superior memory controller of the nforce2 makes a difference here and enables Nvidia to score a victory in the memory test; also the dual channel controller in KT880 makes the KT600 memory score looks anemic!
HDD score is not taken into account as I switched to WD 150gb on all socket 462 systems with a SATA controller last year and tests on AN7 & KW7 were done in 2021!