Hi There,
On a Reverse Engineering Website, I read the following :-
"For finding the graphic routines you have two options:
The first is to entirely use IDA, and simply search for immediate values of 'A000h'. Since this is the area of memory that graphics are commonly displayed in, it can be a quick way to locate graphic routines.
The other alternative is to use the DosBox Debugger. It has a use command called 'bpm' that allow you to set a memory breakpoint, which then gets triggered if the given memory address changes. So you could do 'bpm A000:0' to set a breakpoint on the first byte of the screen memory (i.e. the top left hand corner of the screen). Then whichever routine modifies it first will trigger the breakpoint. Using the previously discussed techniques, you can find the same place in your IDA disassembly, and look into reversing that method first.
It will be likely that related functions will be next to each other, so once you've looked into the given identified function, you may also be able to review previous or following functions to see if they have identifiable graphic routines."
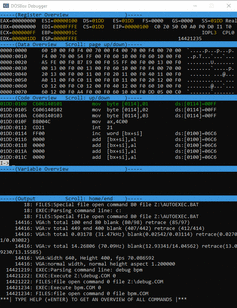
I am trying to find In IDA Pro 5 the Assembly Code, For a Plane in a WW2 Dos Game. I typed the bpm A000:0 in Dosbox X Debugger and then ran the game and changed to a view showing the Plane in Question.
I got the following output :- DEBUG: Memory breakpoint : A000:0000 - 9F -> 15 what does this output mean ? In IDA Pro 5 with the game .exe File Decompiled what should I search for ?
I have allready looked for A000h in IDA Pro , but what should I interpret from that DEBUG line i.e. what does 9F -> 15 mean ?
Any help and info would be much appreciated.