Reply 20 of 34, by retro games 100

Rank
l33t
- Rank
- l33t
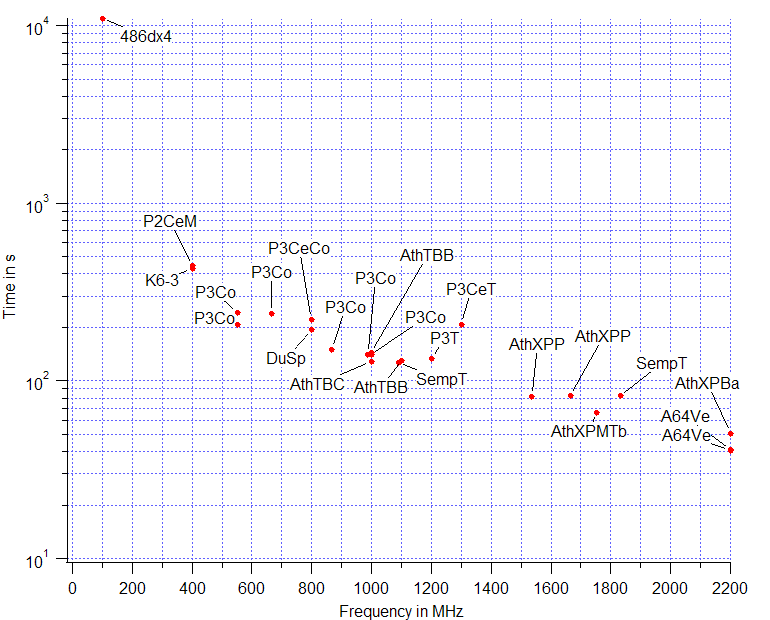
wrote:Frankly, I have no idea how to make nice little graphs, but it could help make it easier to compare results.
Consider downloading the free Open Office organisation software suite. In it, you'll find a spreadsheet. Using it, you can turn the data in to a bar chart graphic. You'll then need to convert this graphic in to a picture, for uploading to Vogons for example. I'm not sure the best of way of doing this. In the past, I've used a screen capture program to "grab" the bar chart graphic from a spreadsheet in order to convert this image to an uploadable picture.