First post, by elianda

- Rank
- l33t
After the ongoing discussion here I thought I try to measure some actual values how the signal of a few old 2D cards look.
How I did it:
I exploited my capture card (Epiphan VGA2PCIe) to analyze a digital image the specific 2D card shows on its analog VGA output.
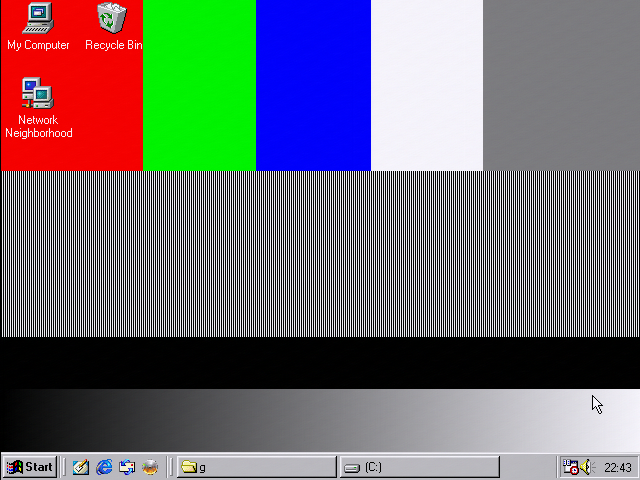
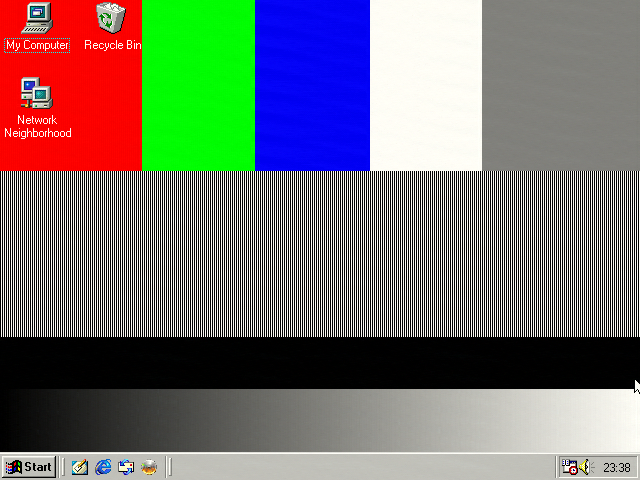
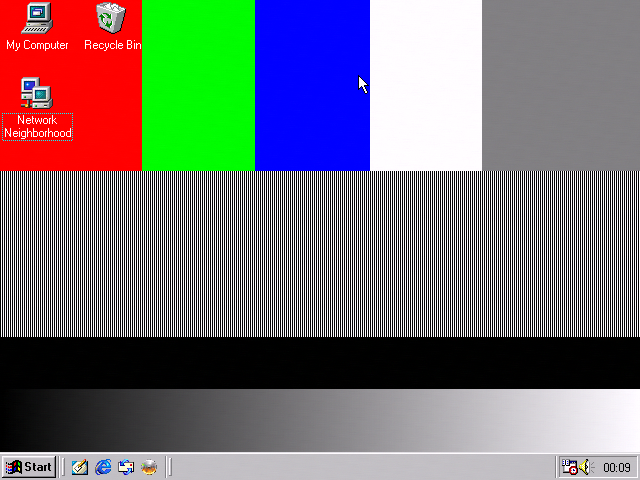
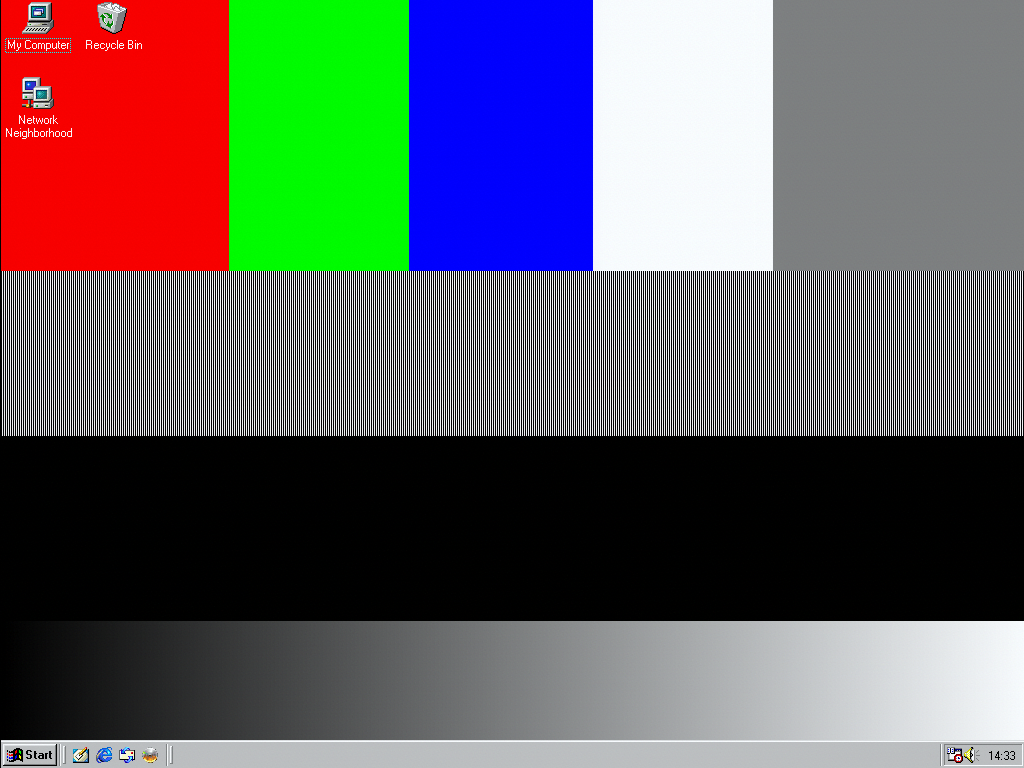
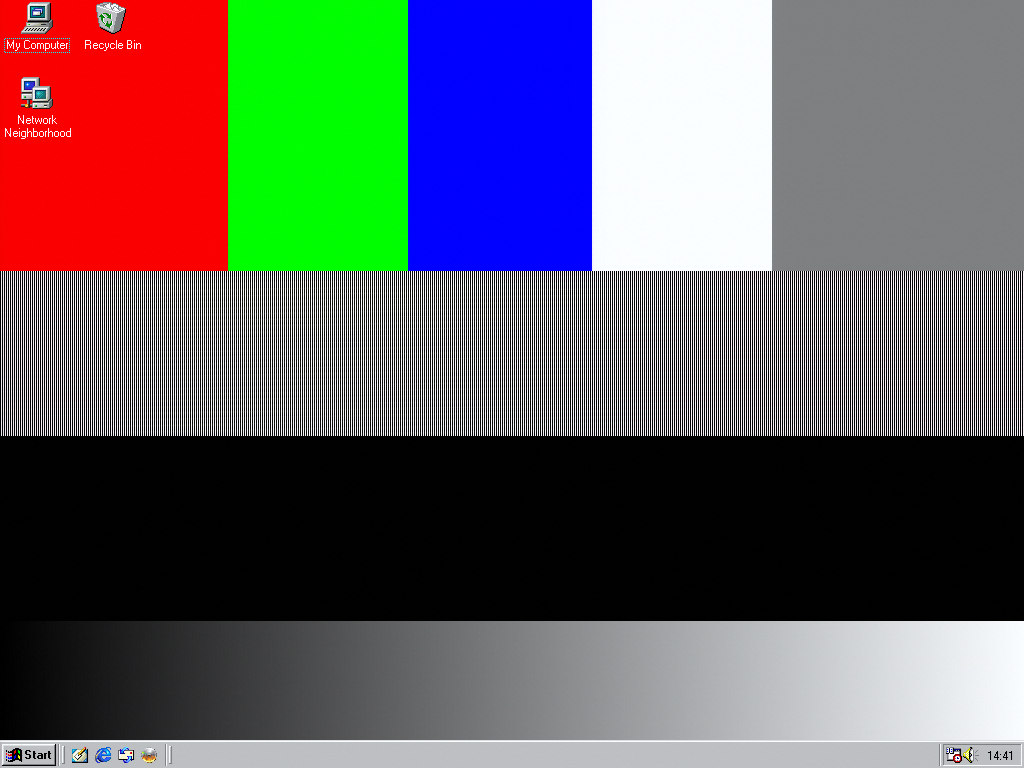
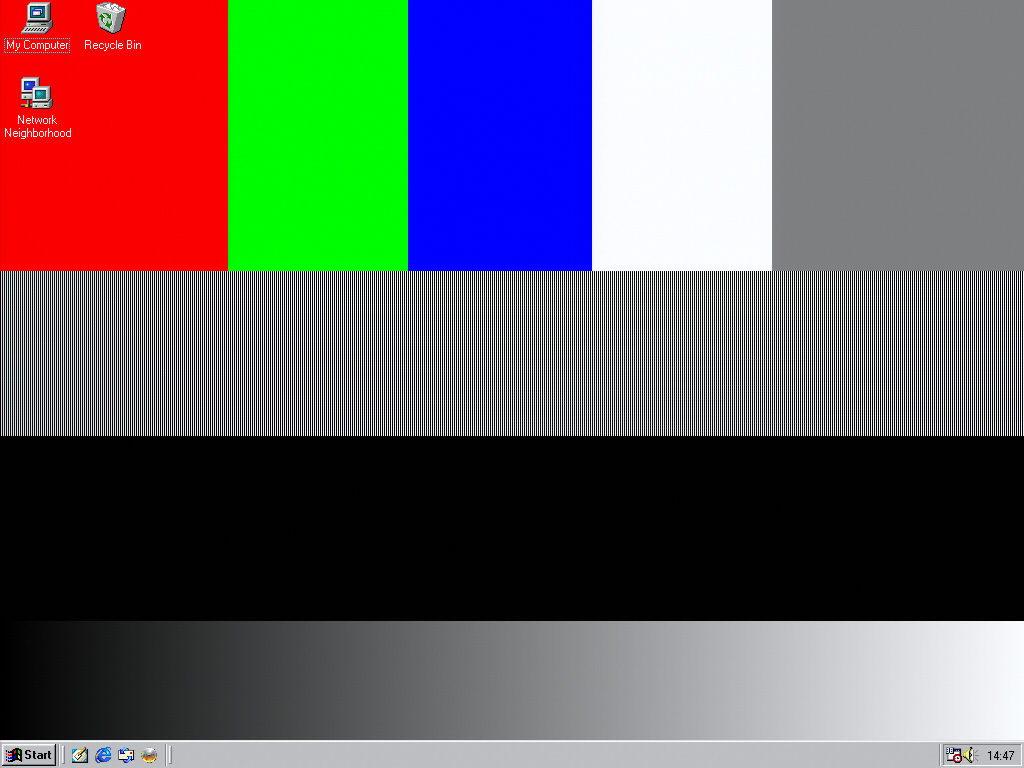
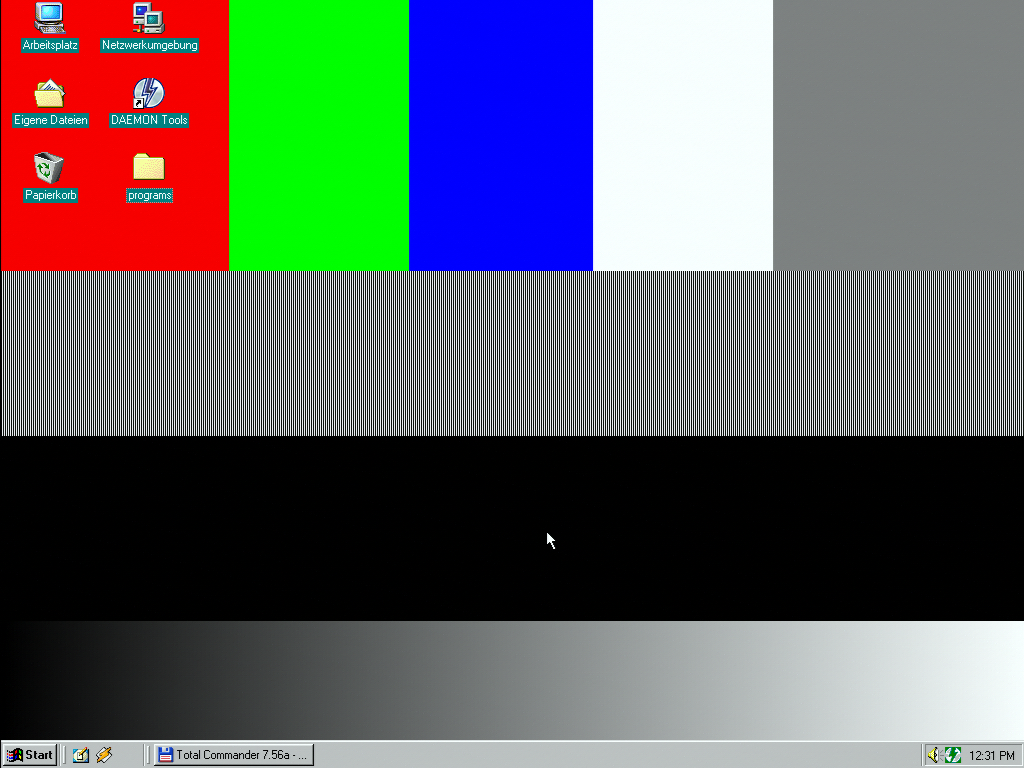
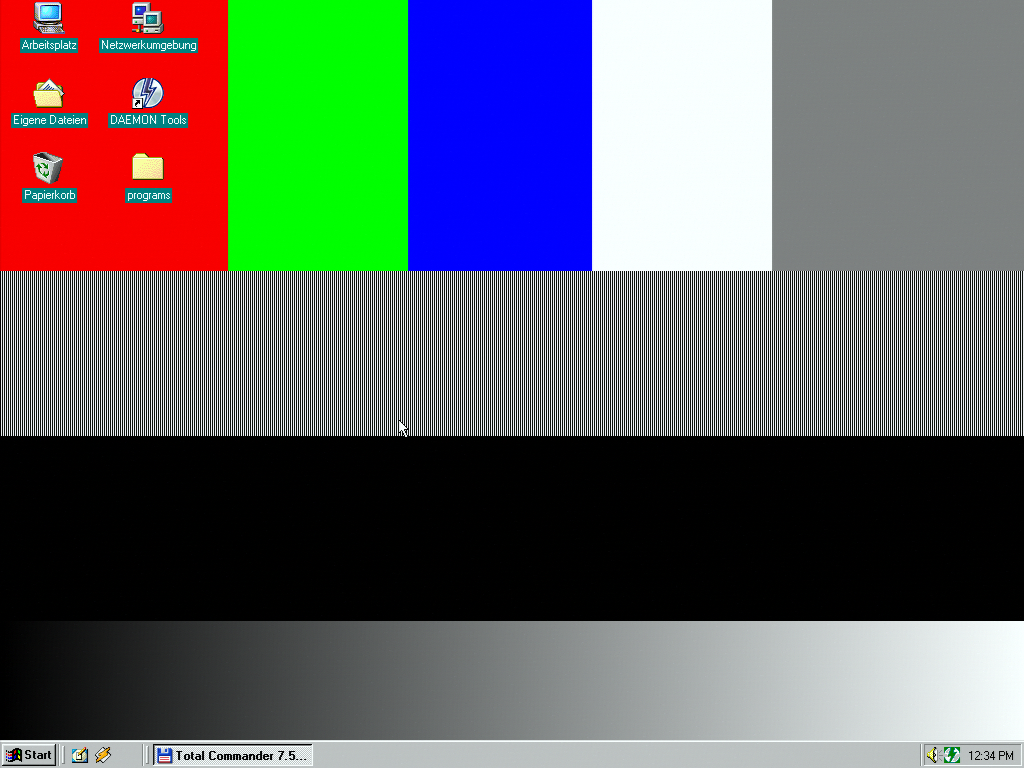
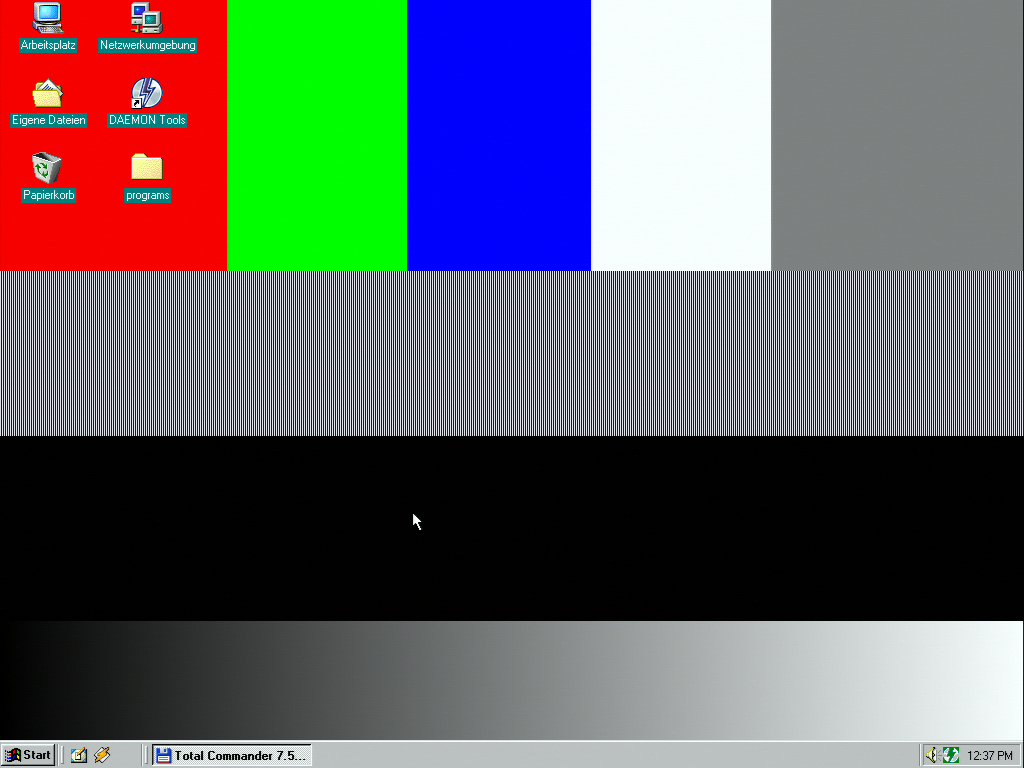
The test image I used is this: http://mail.lipsia.de/~enigma/neu/graphics_comp/test.bmp
It is a 24 bit BMP file that has in the upper area colored squares with red / green / blue / white and 50% gray.
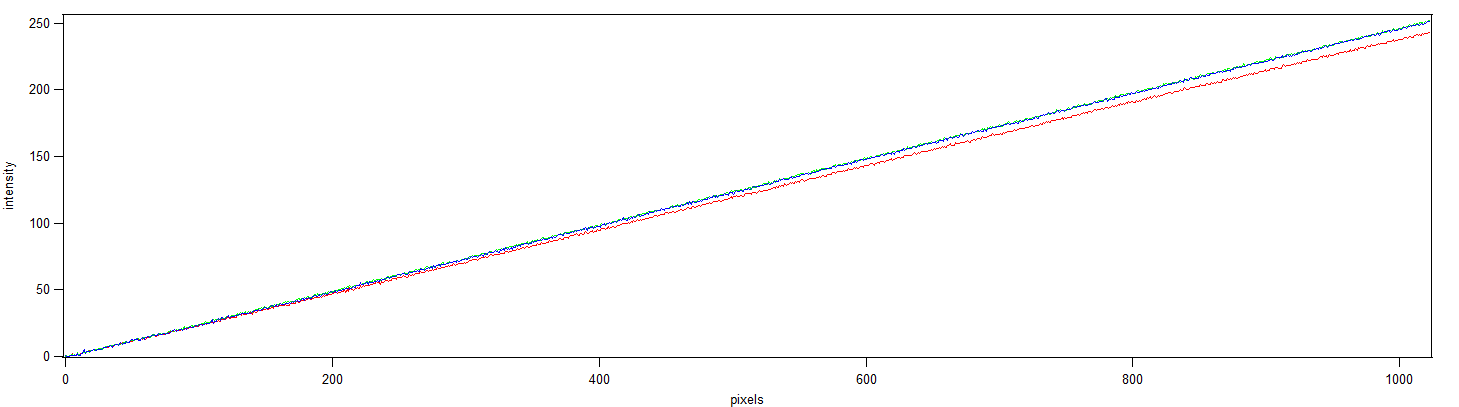
Below are vertical white lines alternating with black lines. Then a black area and a black to white bar.
I used Win98SE and put the BMP as background image and set each card to 640x480 at 60 Hz.
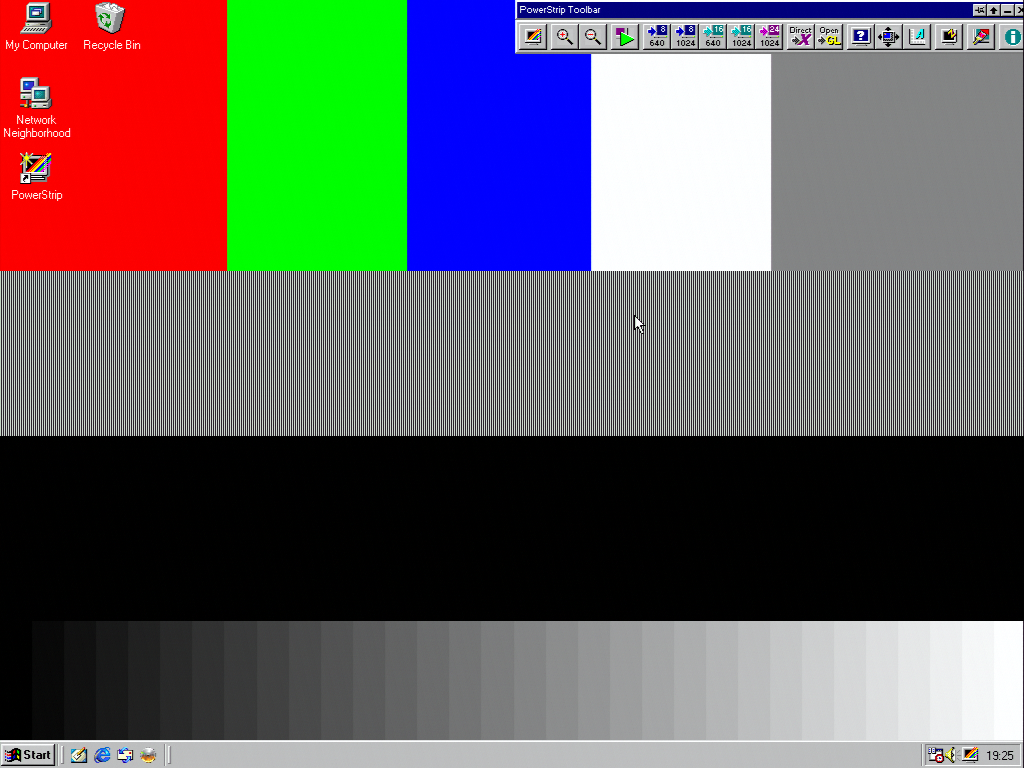
First the sampling PLL of the capture card was aligned that it samples exactly per pixel and then the image was shifted vertically and horizontally that the captured 640x480 matches the 640x480 pixel output of the card.
The capture card also allows to set offset and gain for R,G and B (one setting for all). This is identical to brightness and contrast setting.
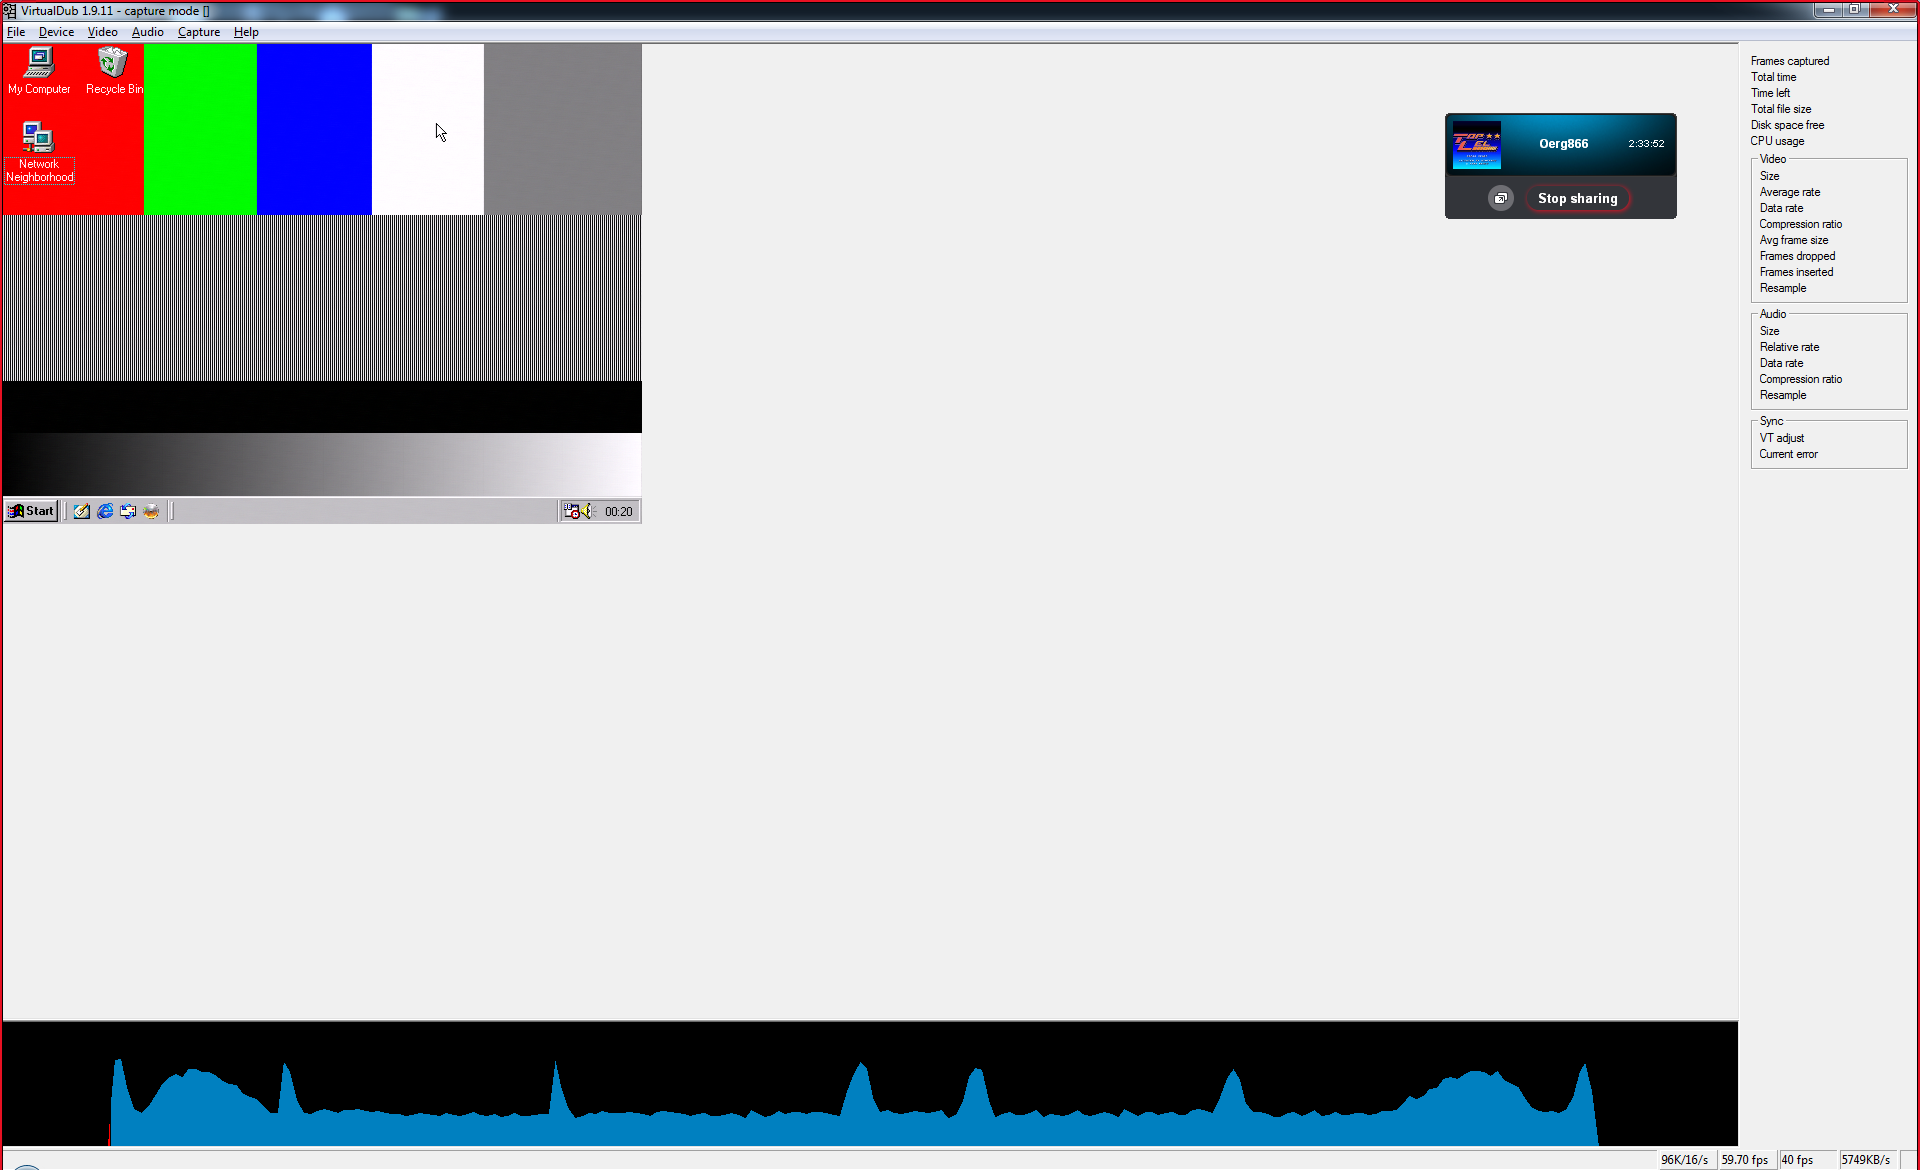
To get this correct I used Virtualdub as shown here: http://mail.lipsia.de/~enigma/neu/graphics_co … ase_correct.png
You can see at the bottom the histogram of the image. I tuned the offset such way that the black peak touches the left end of the histogram scale then tuned the gain that the whole range fills the range and the white peak touches the right end of the scale. This is the same as tuning brightness and contrast of a CRT to get the best representation.
Afterwards I tuned the sampling phase to hit exactly each pixel when the voltages are stable. A wrong sampling phase introduces brightness variations over the image and can be seen as a splitting of the white and black peak. As example if the stable white has some additional brightness variation it changes between some gray value and white, which results in a "near white gray peak" and a white peak in the histogram.
This can be seen here for wrong sampling phase: http://mail.lipsia.de/~enigma/neu/graphics_co … e_incorrect.png
There a broad peak near black and a broad peak near white are shifted inwards. (compare to the first image)
The sampling phase was tuned such that the peaks are sharp and do not split.
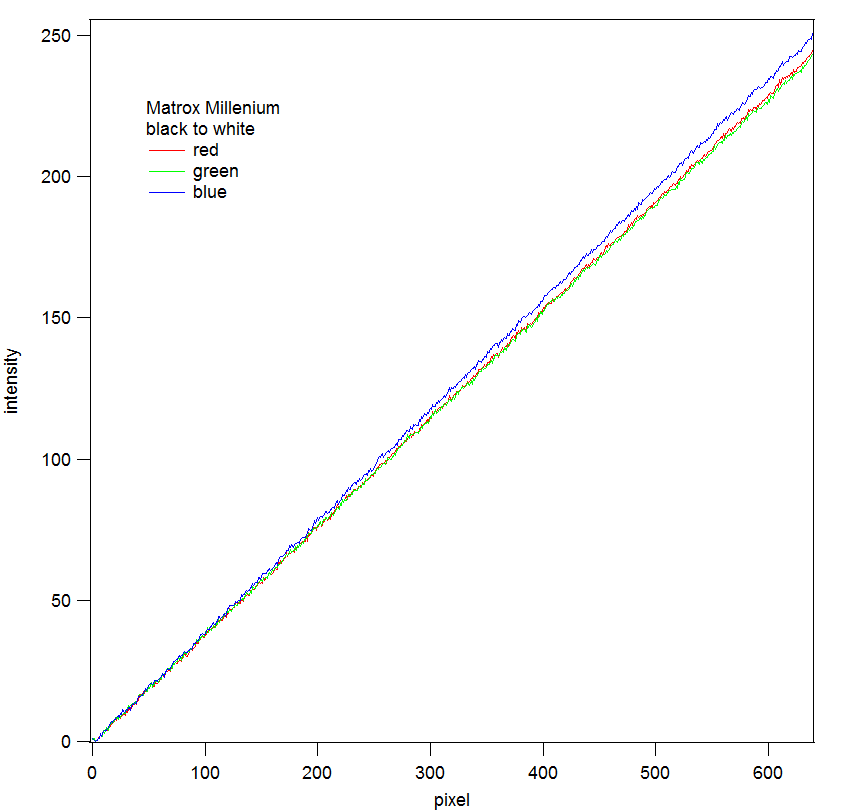
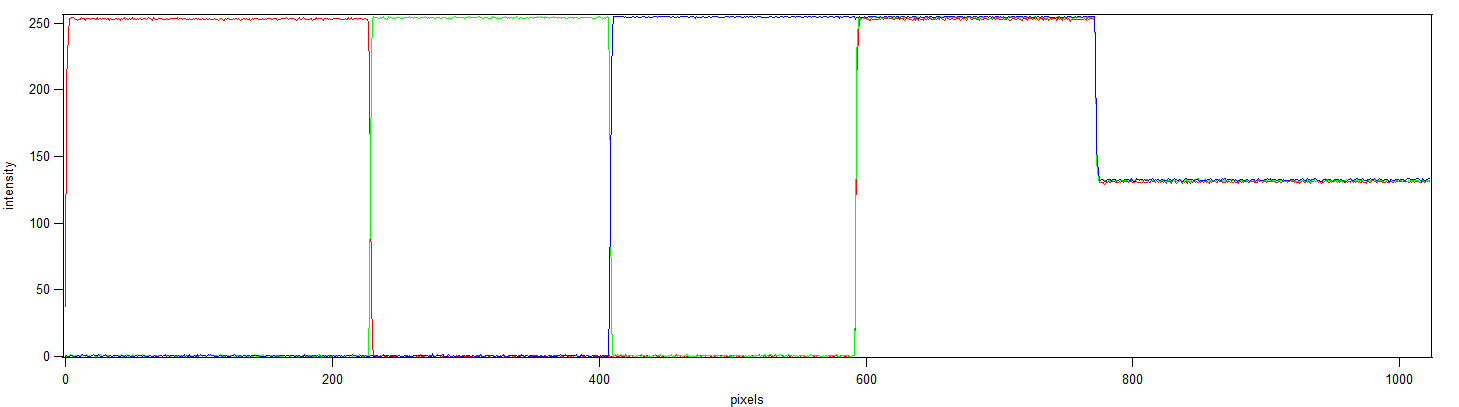
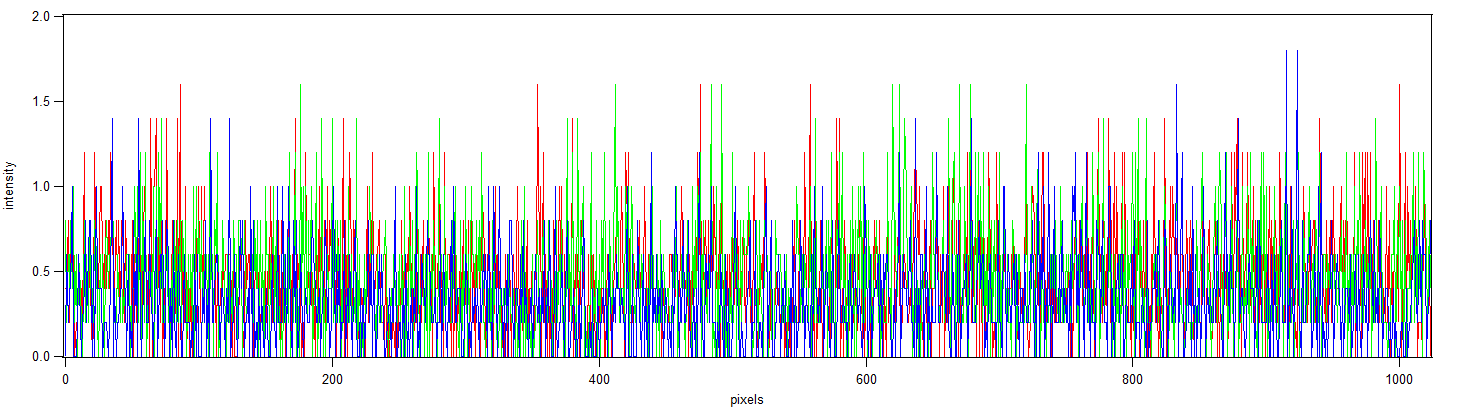
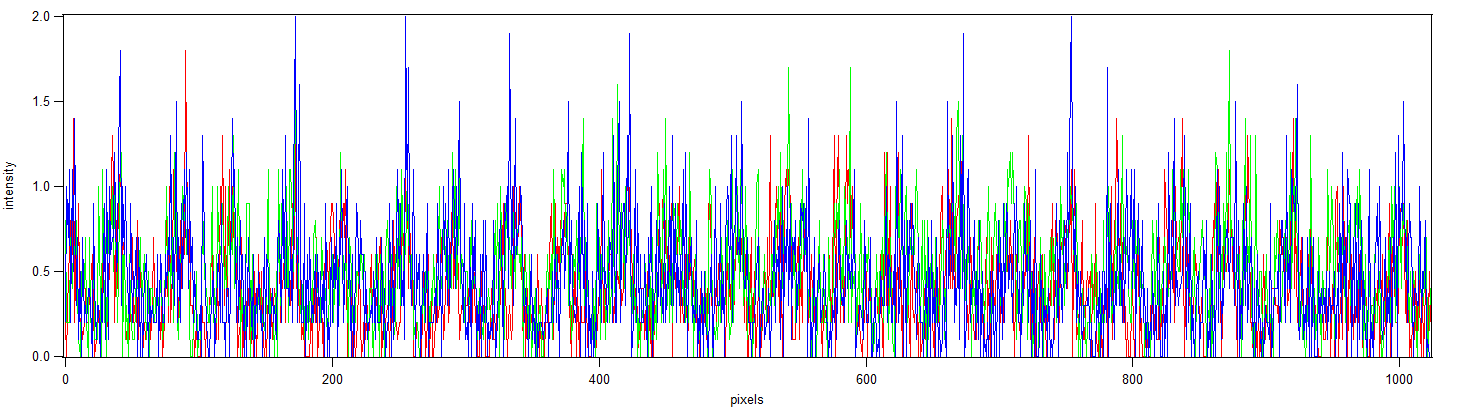
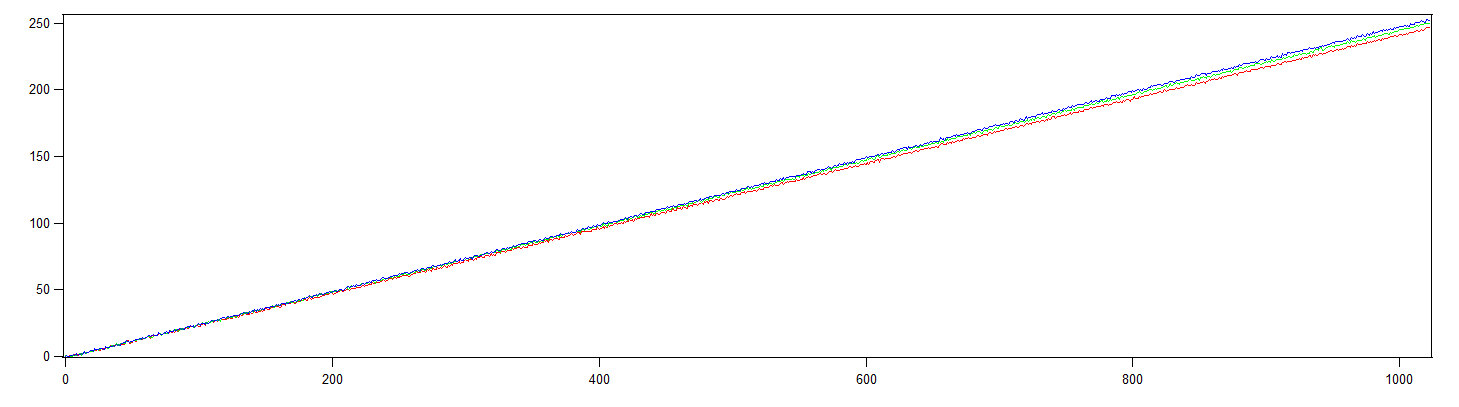
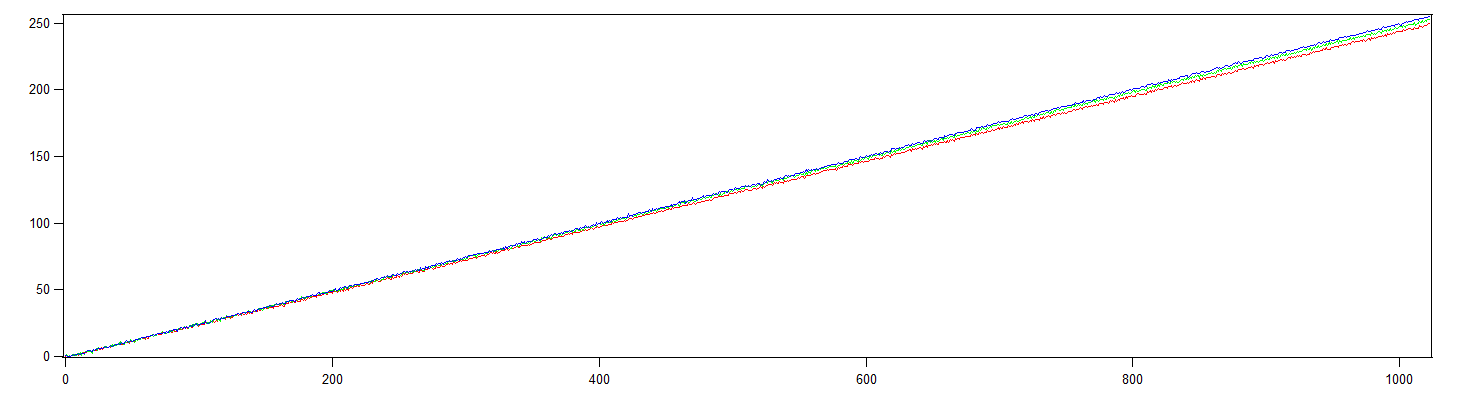
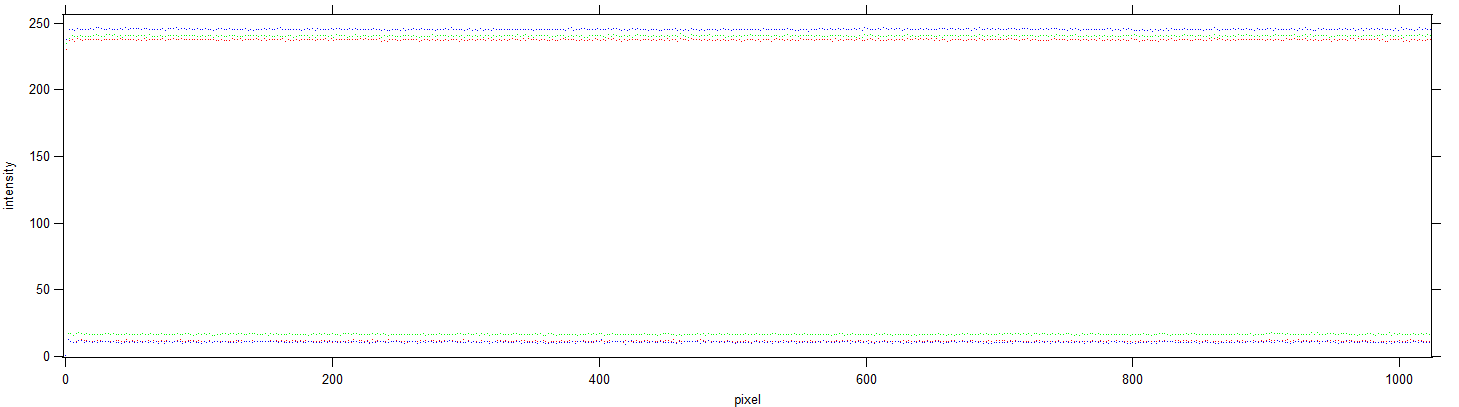
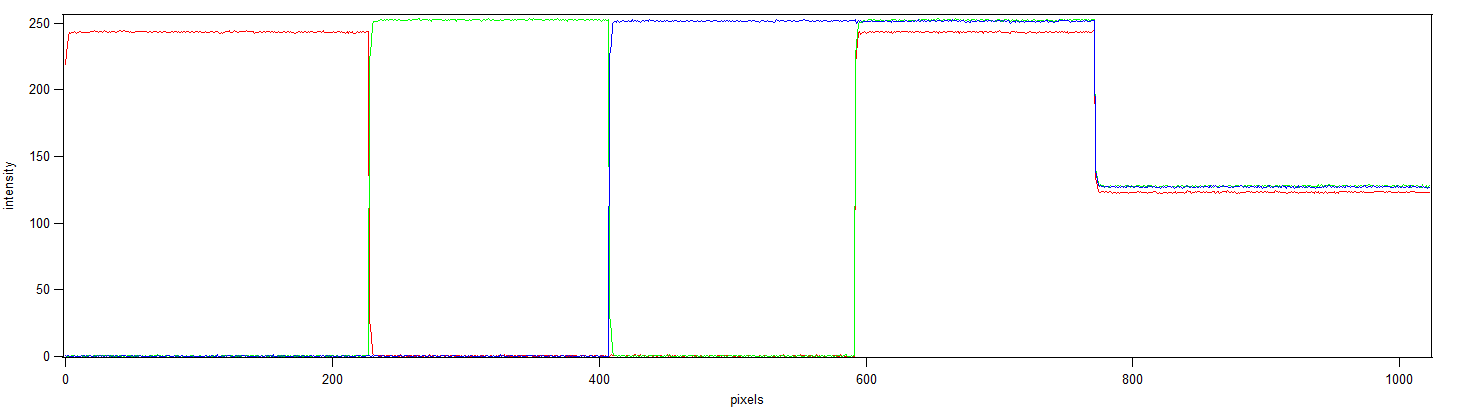
This was done for each card then an image was captured. I used Igor Pro from Wavemetrics to put horizontal Profile Lines over each area with the (vertical) width of 5 pixels.
Interesting to compare is:
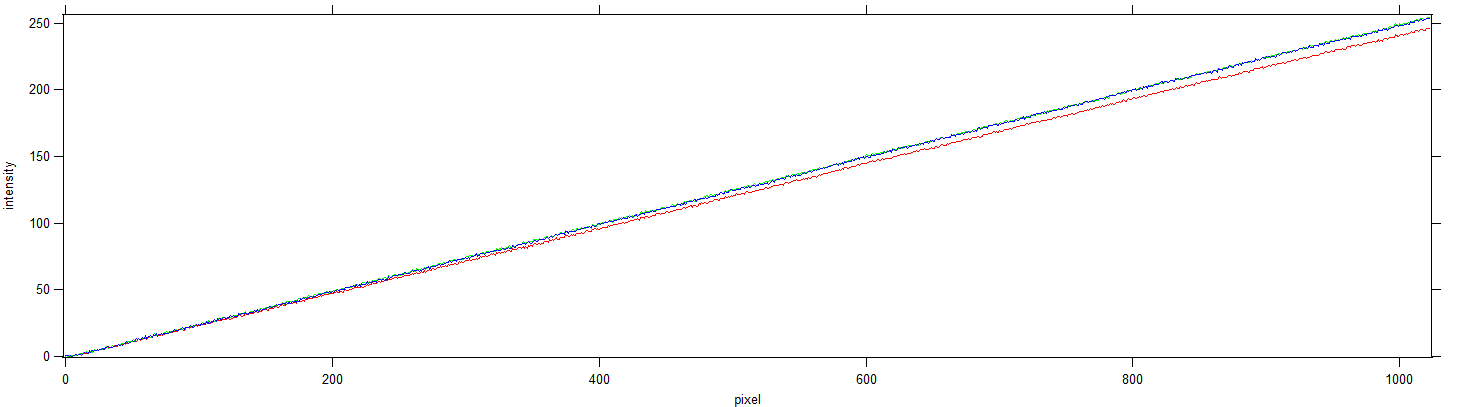
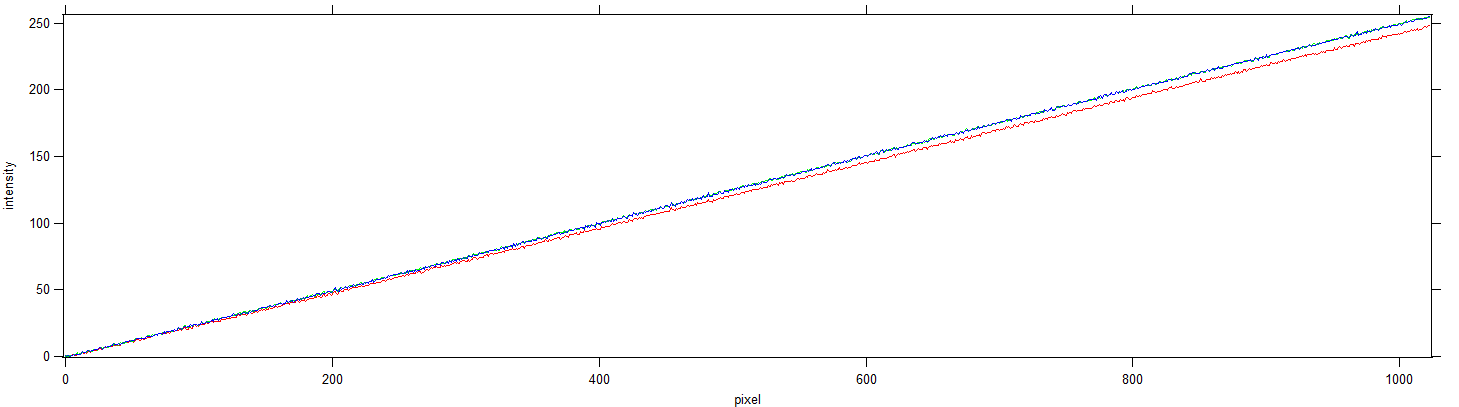
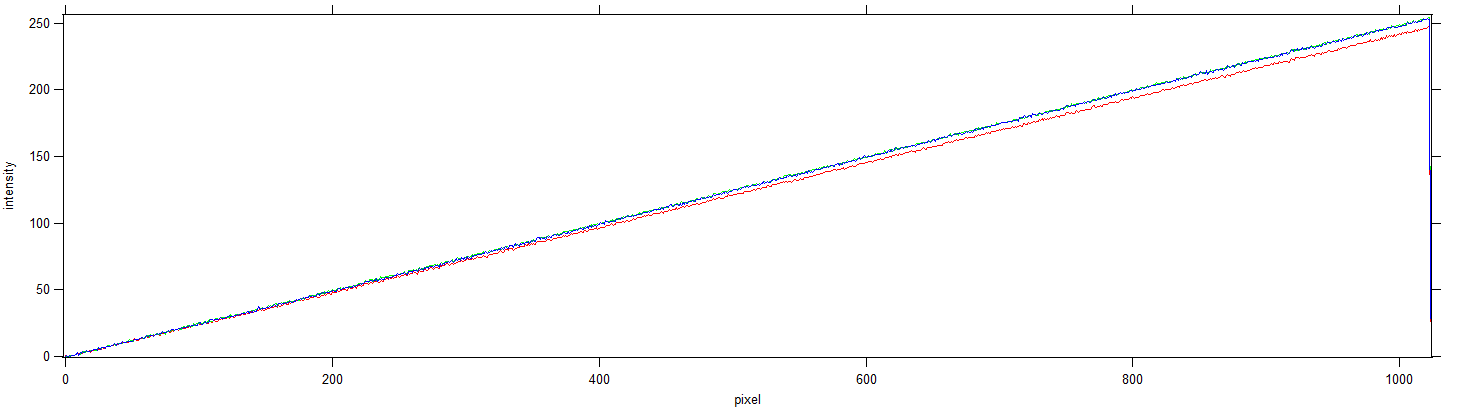
How each component scales to white on the grayscale.
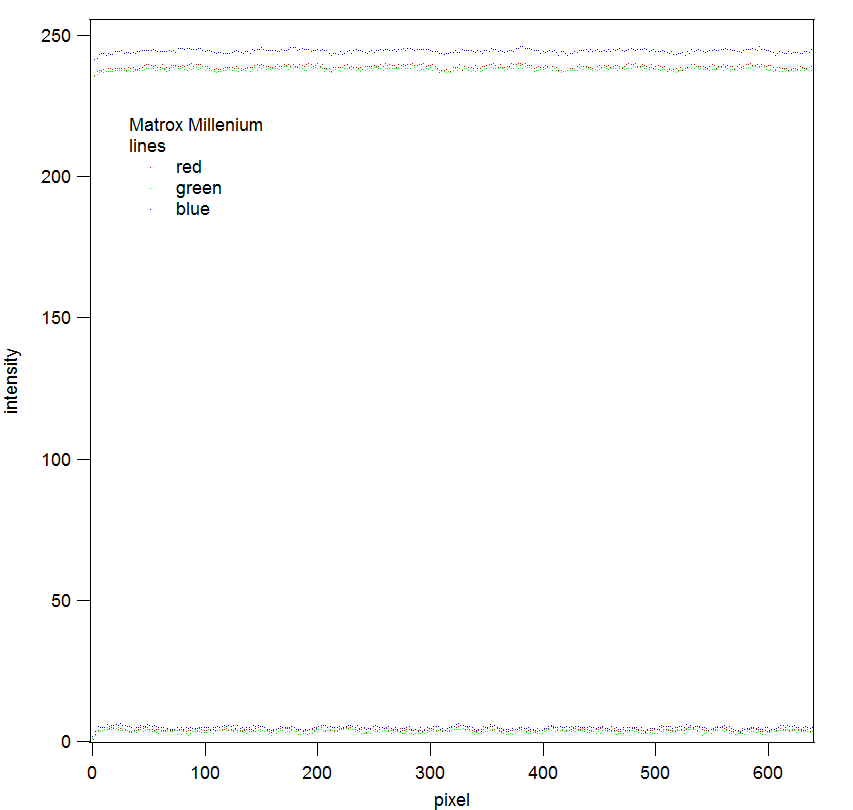
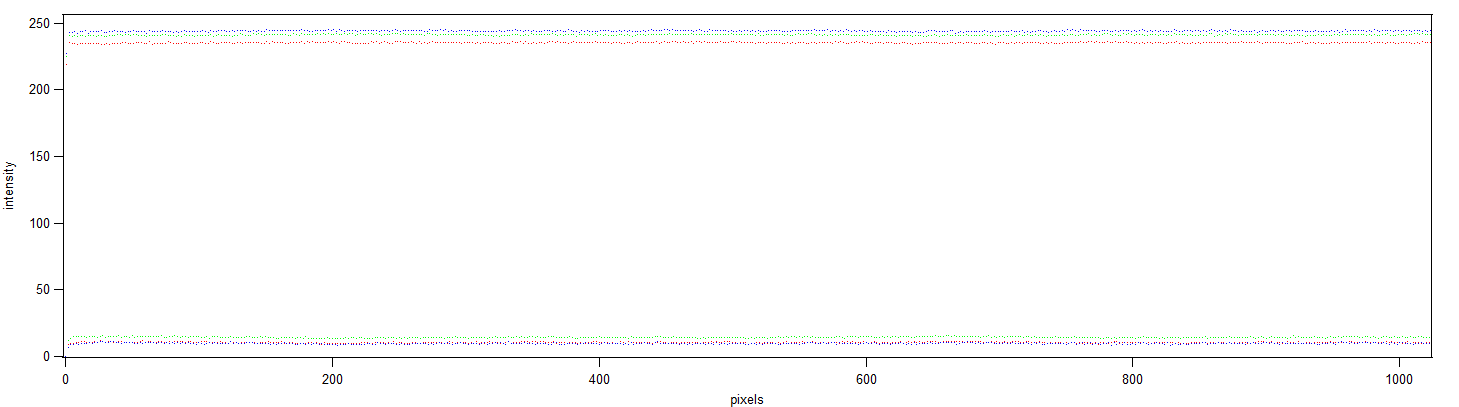
Which value the RGB values reach for the white square in comparison to the while vertical lines.
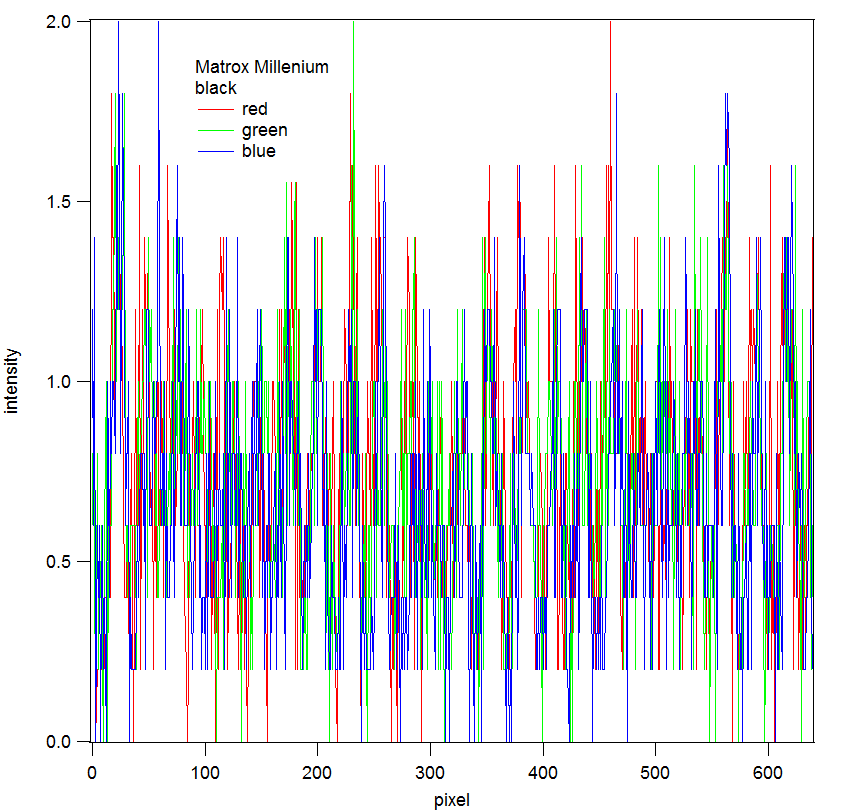
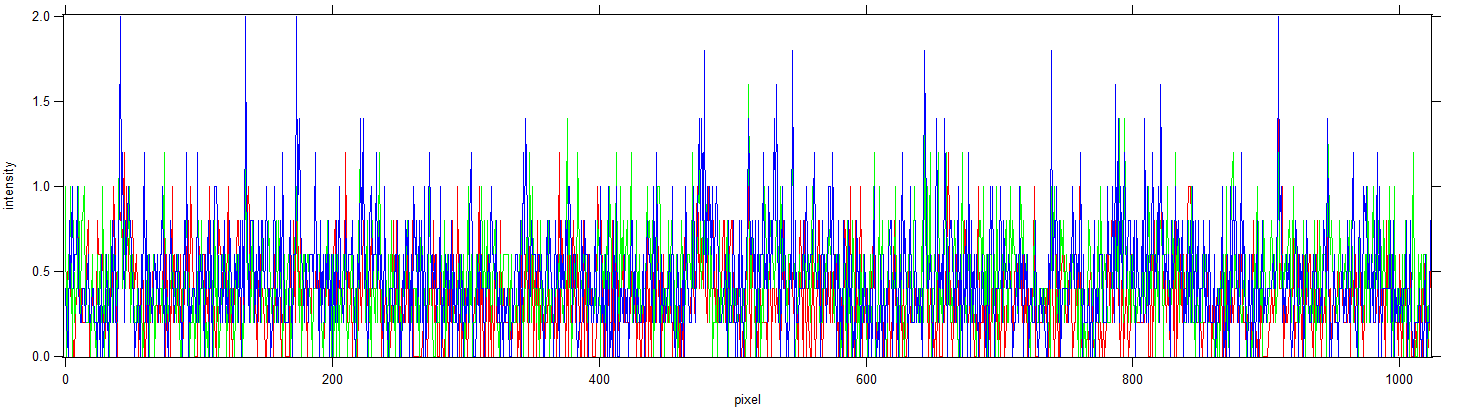
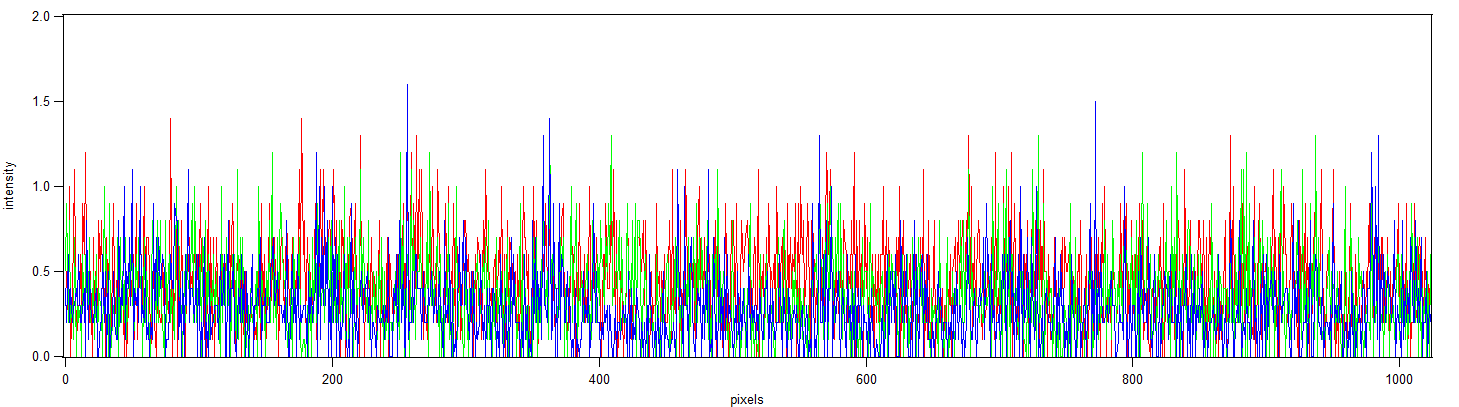
How stable black and white is, and how stable it is in the area of the vertical white lines.
Please note than lower gain values mean a higher contrast and a lower offset means a lower voltage is black.
RESULTS
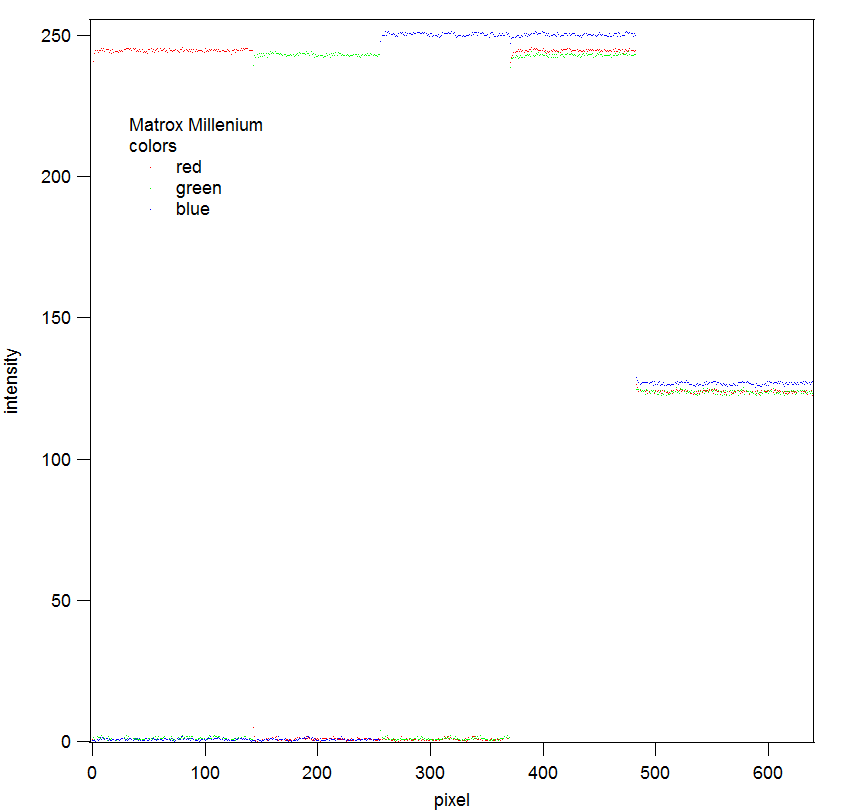
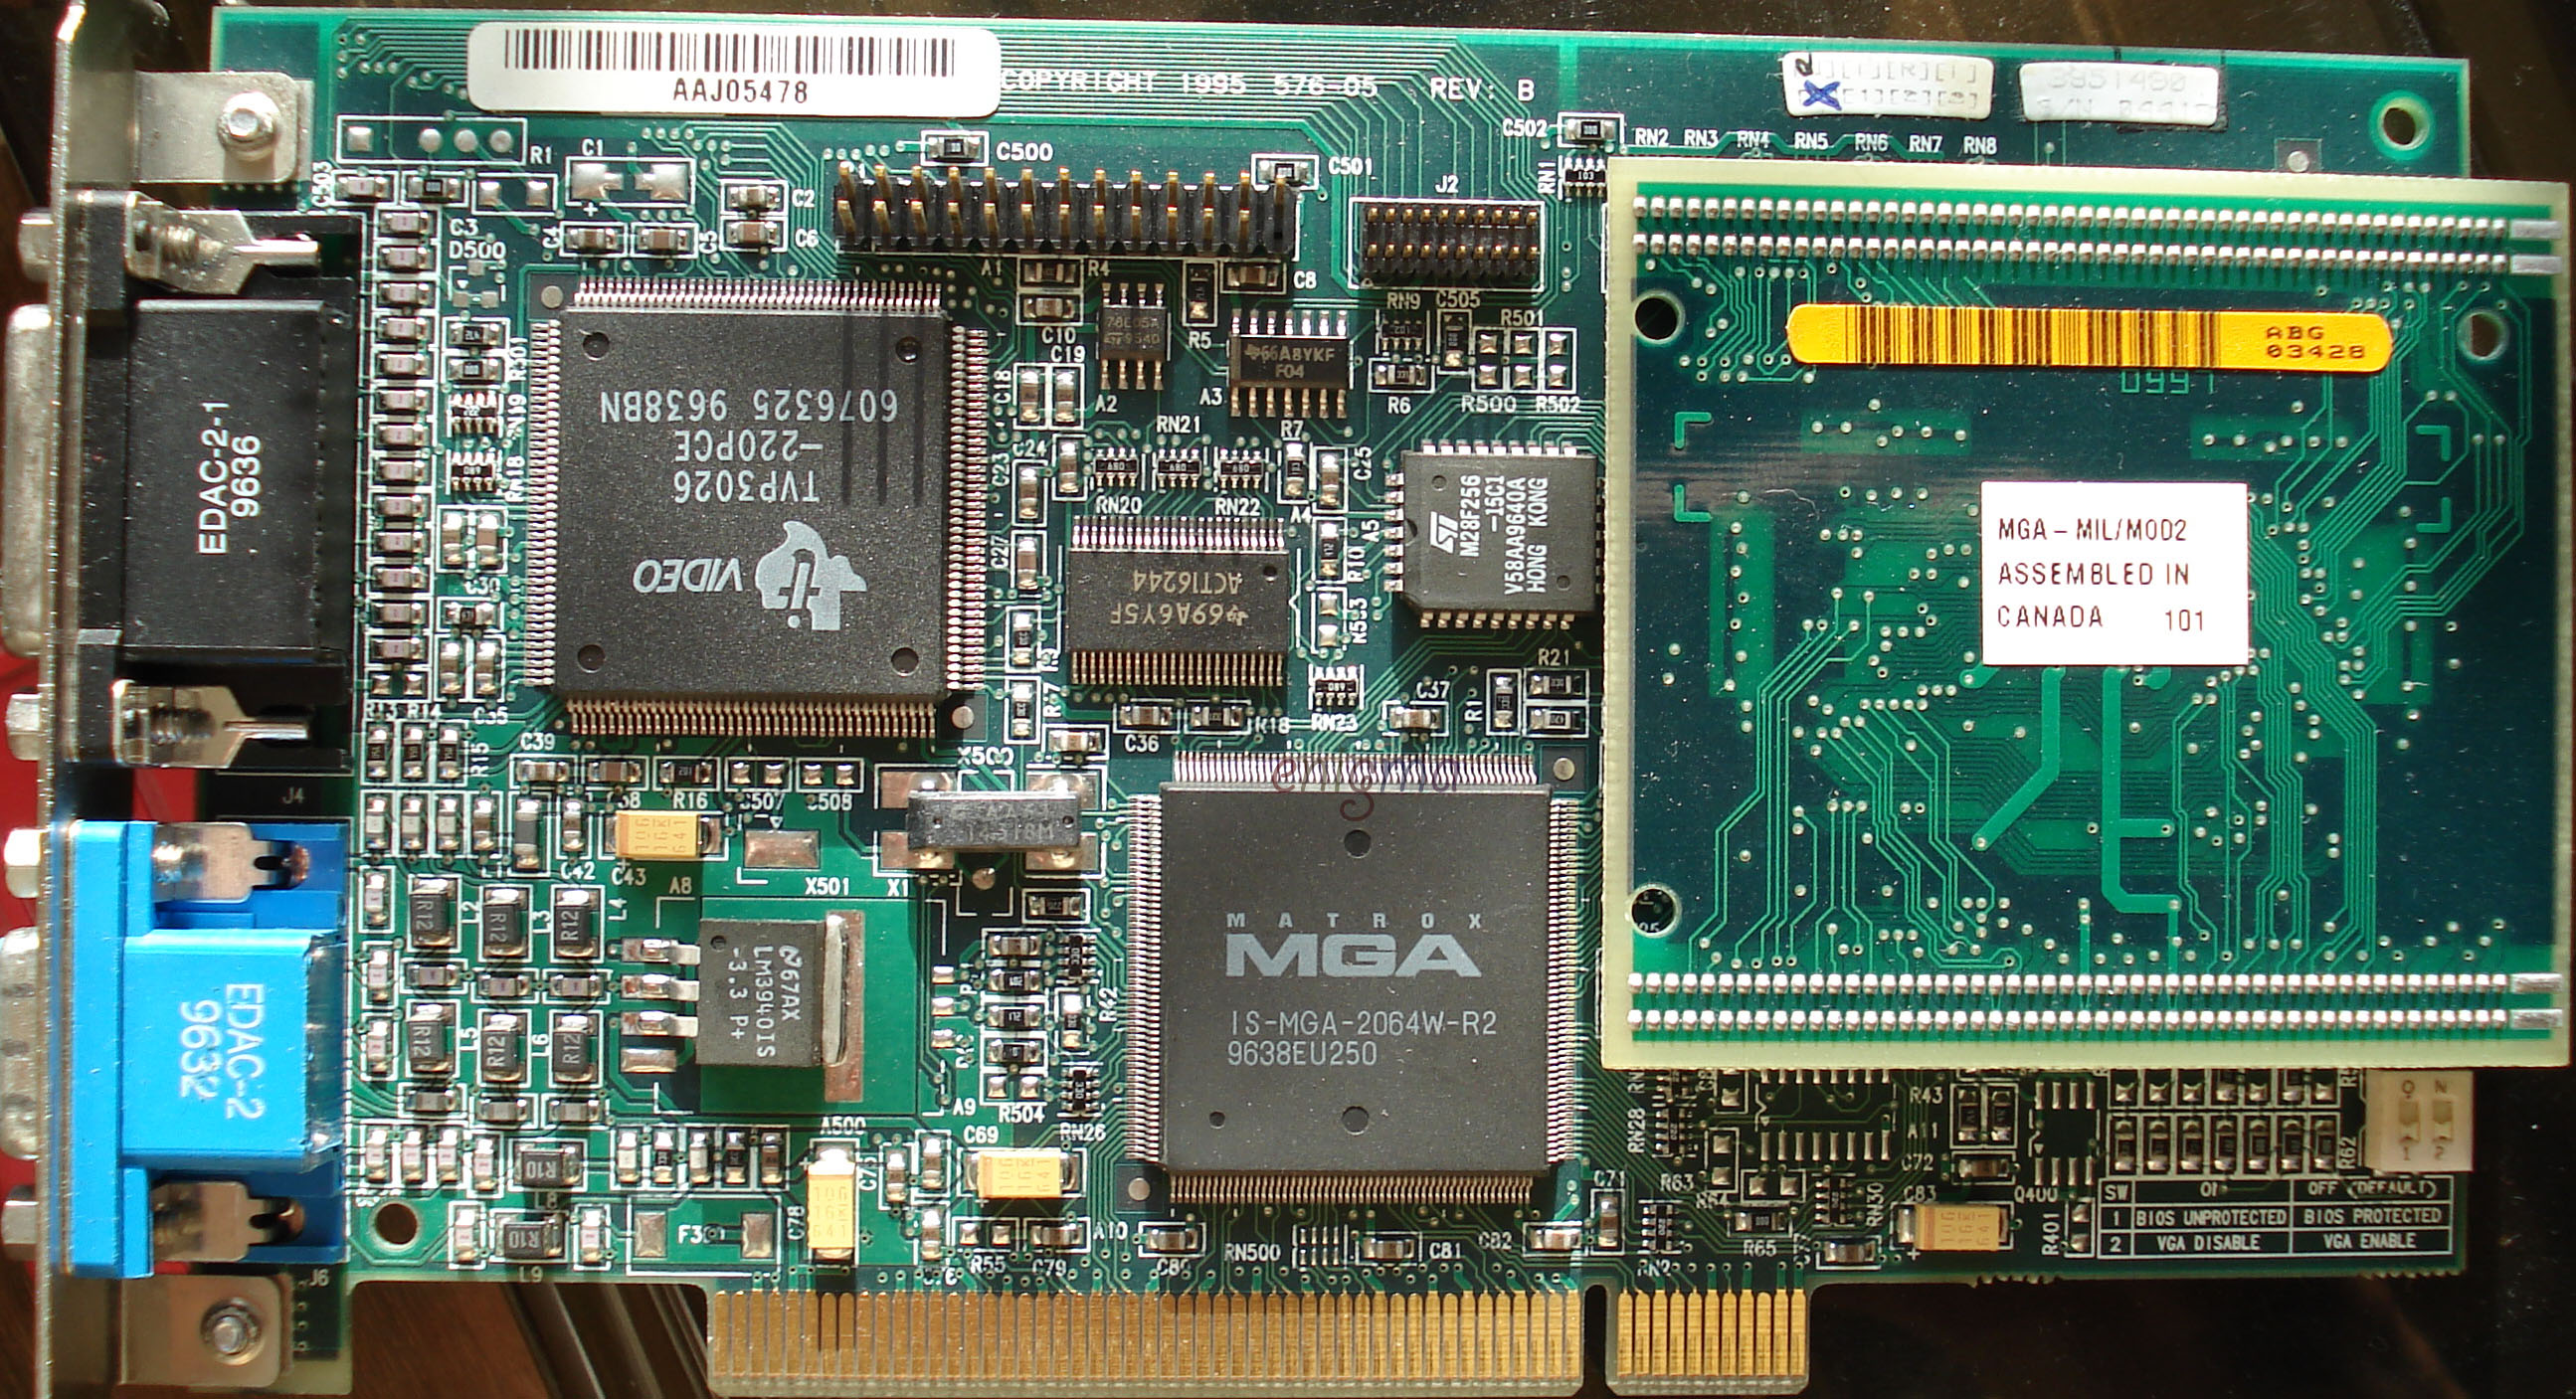
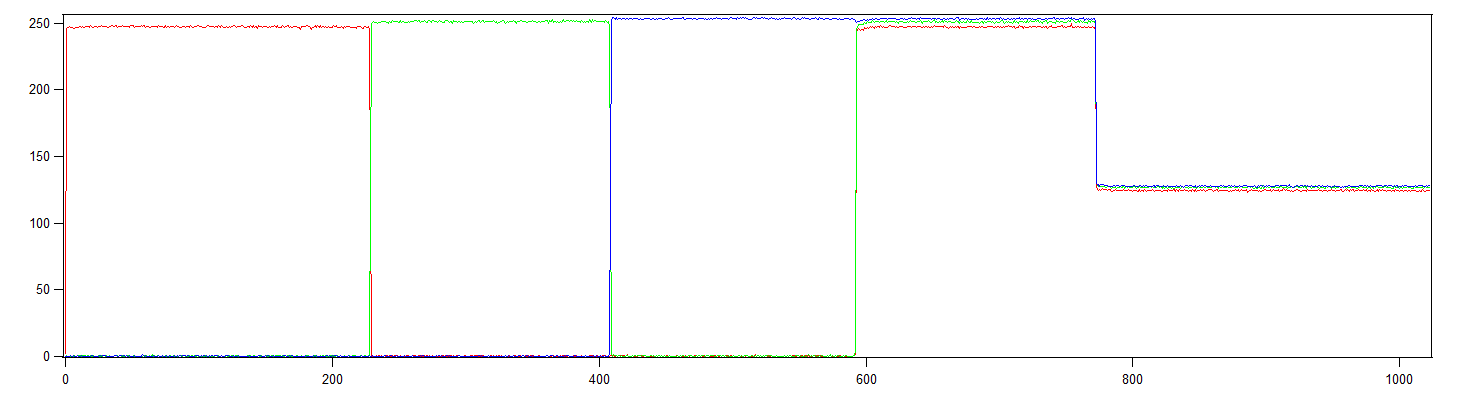
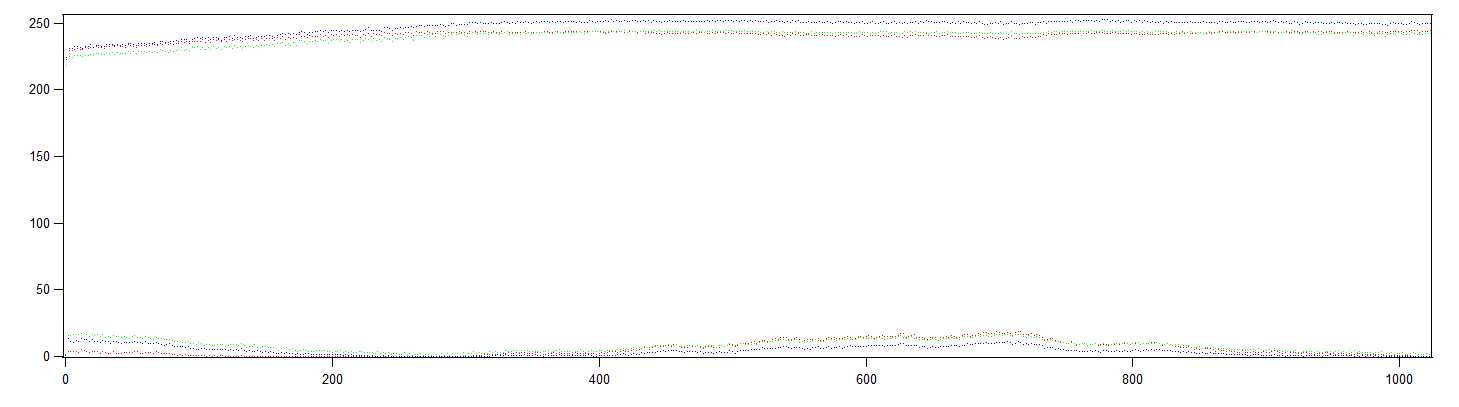
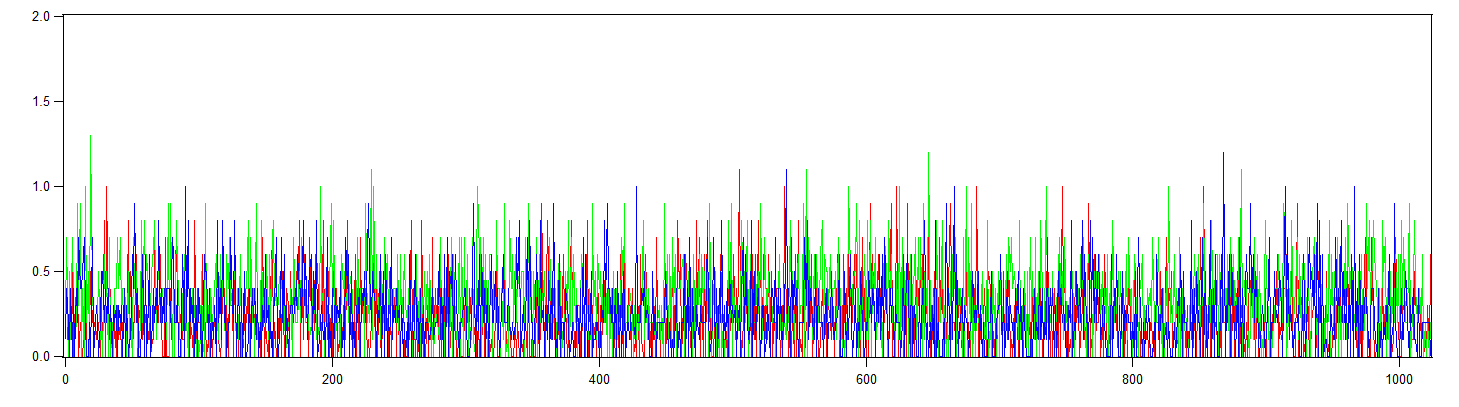
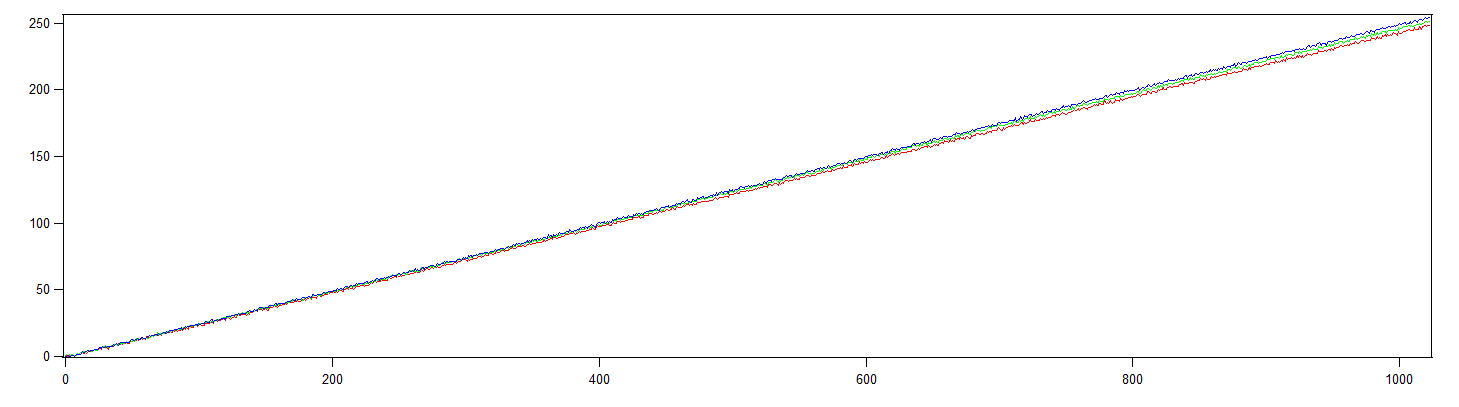
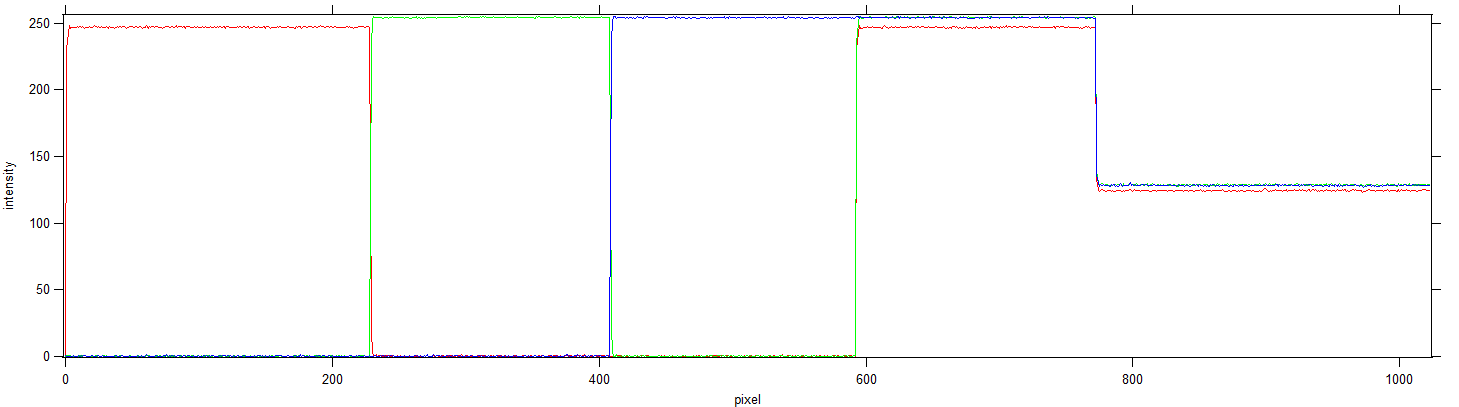
Matrox Millenium
http://mail.lipsia.de/~enigma/neu/pics/matrox … y_expansion.jpg
Used values: Offset 31, Gain 191, Phase 15
Image captured:
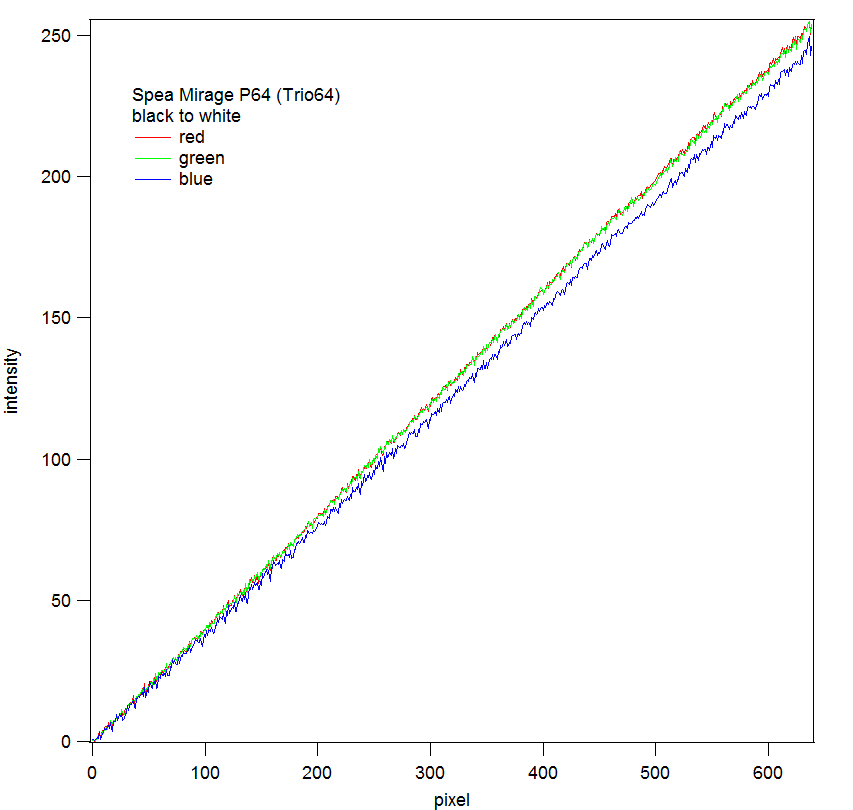
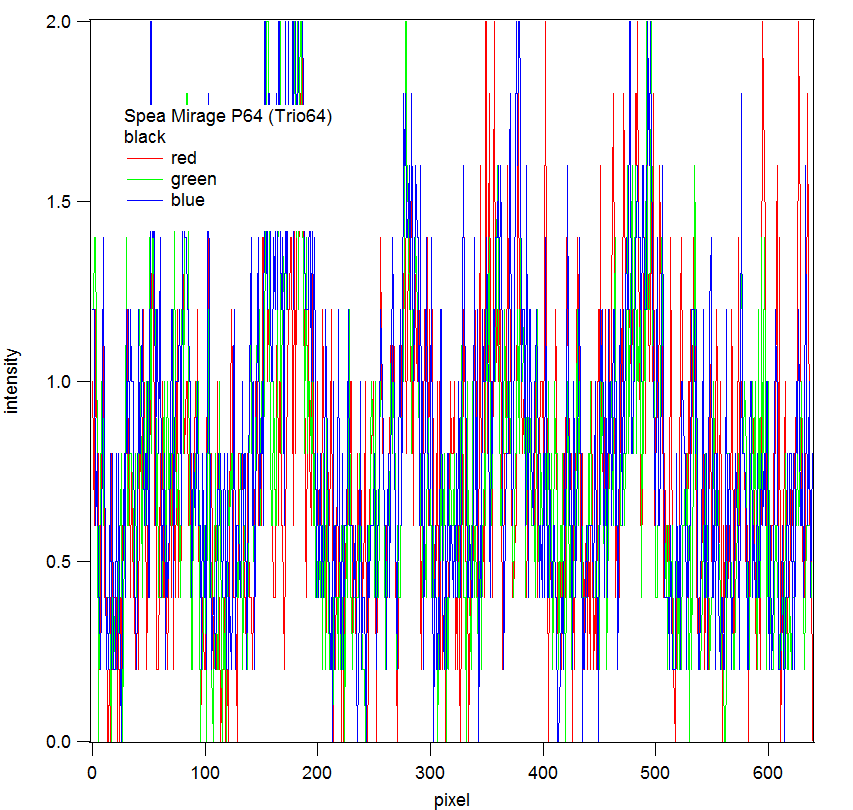
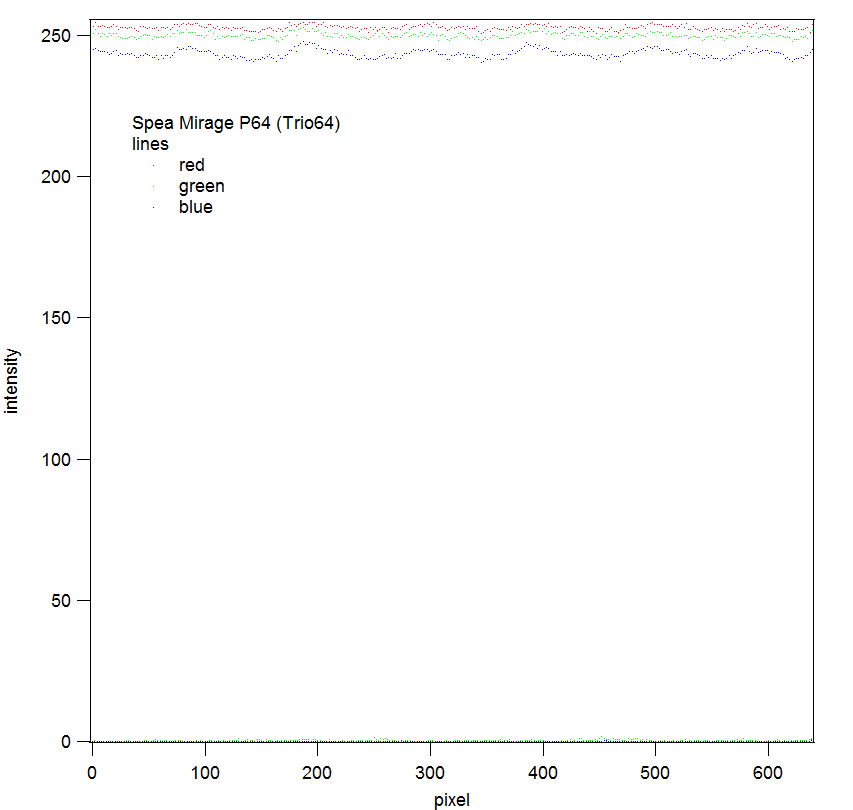
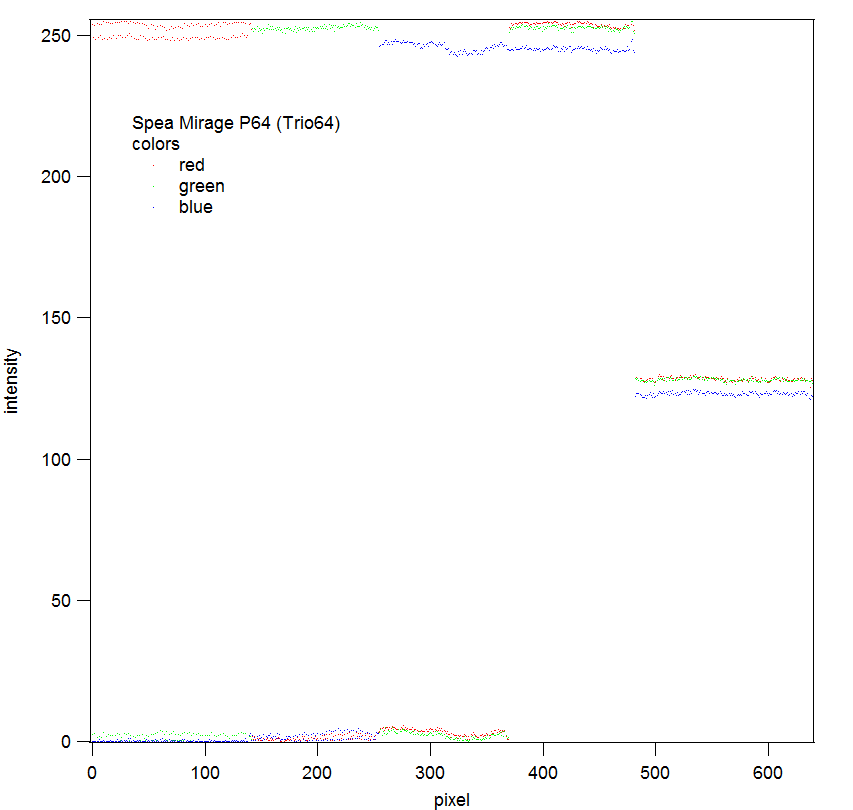
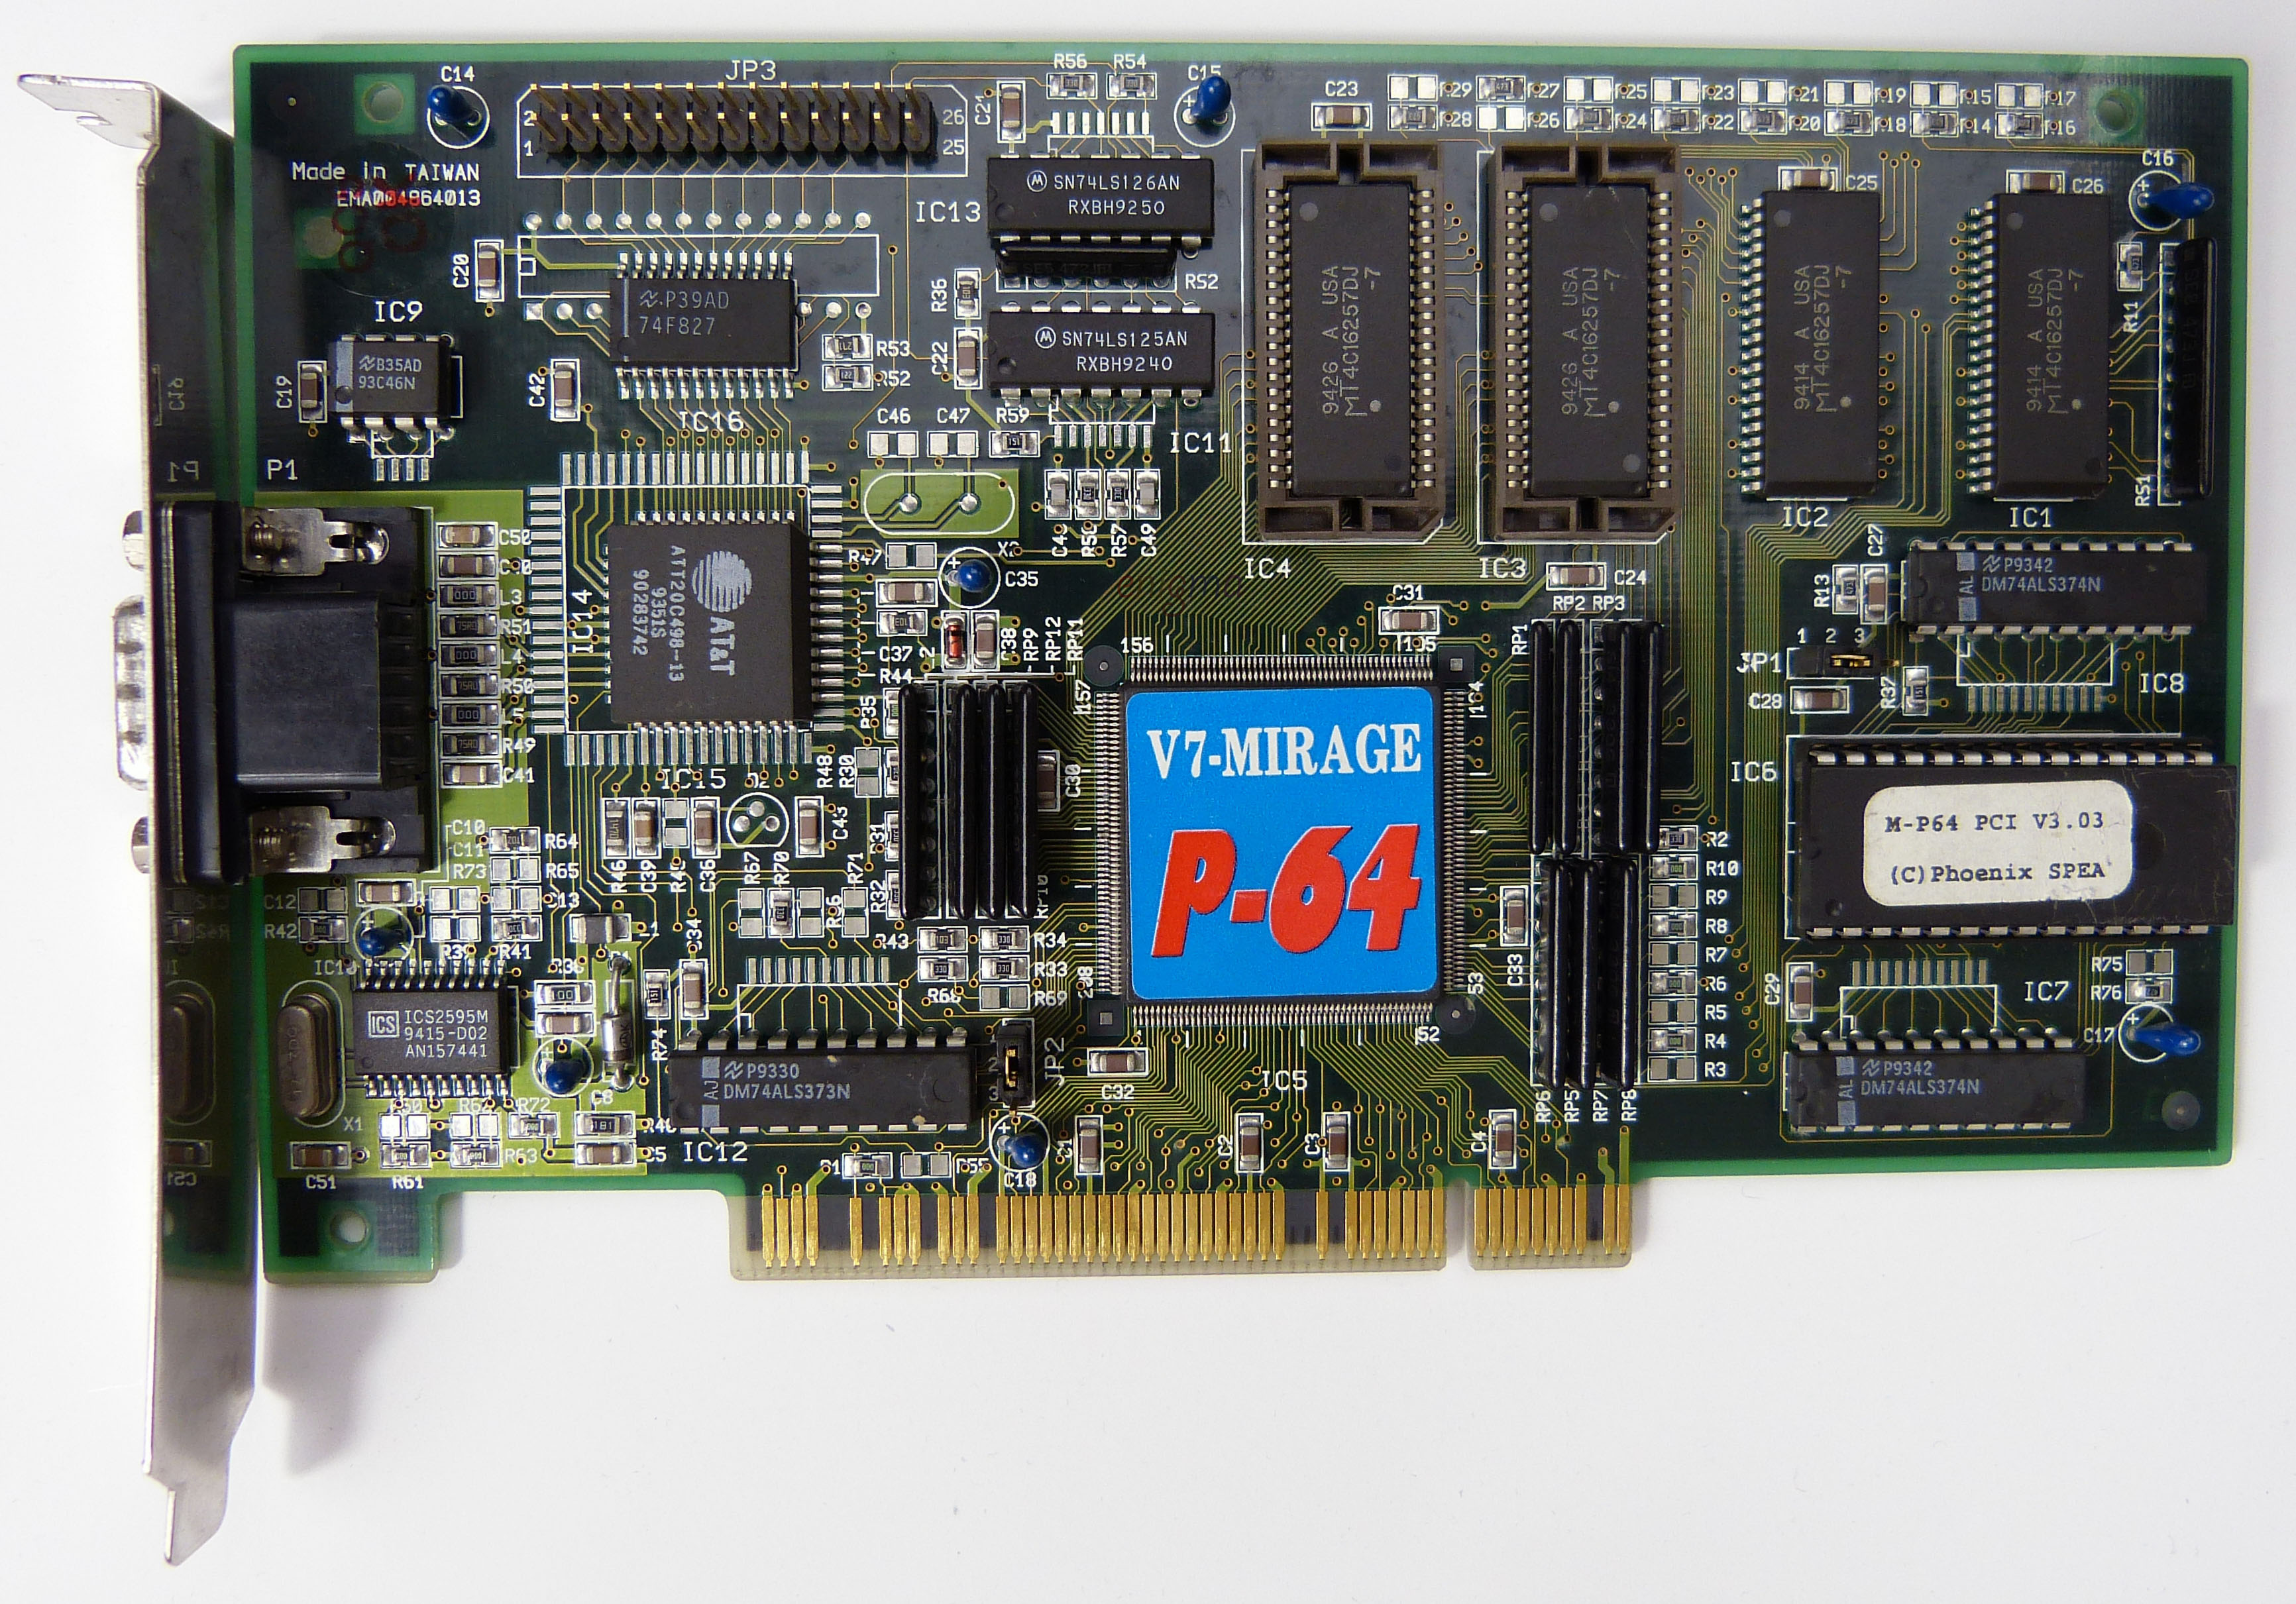
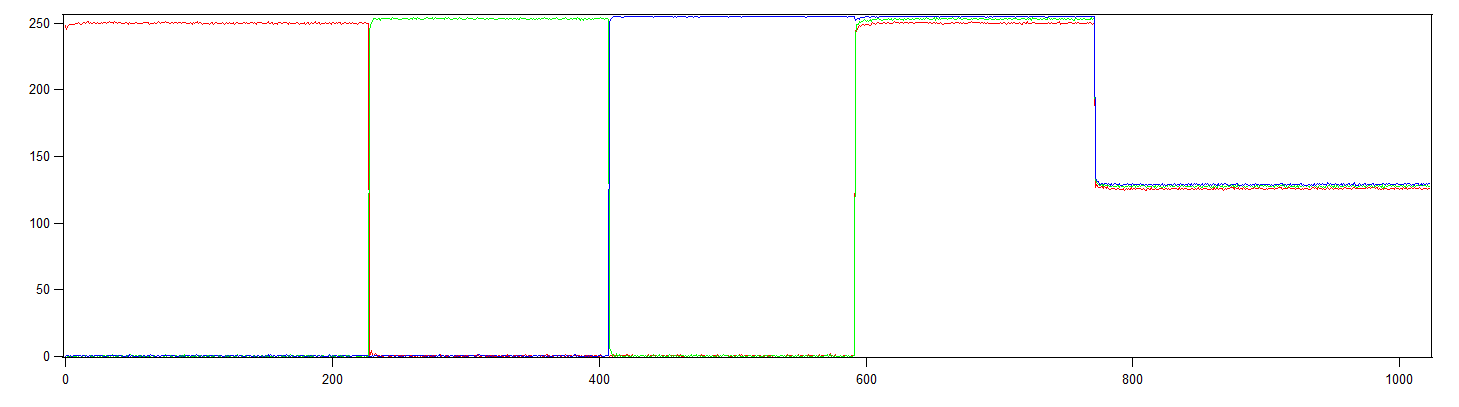
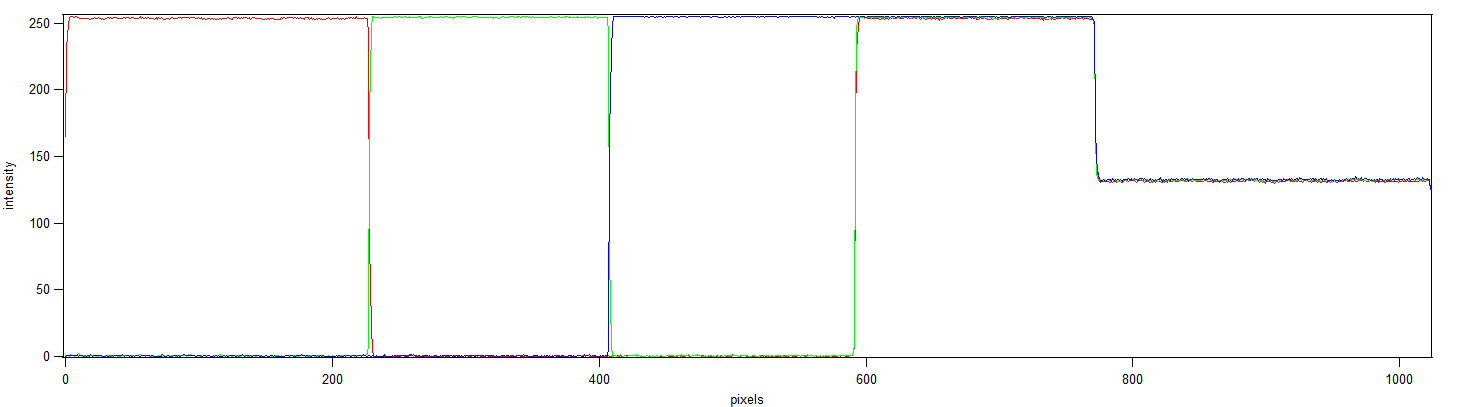
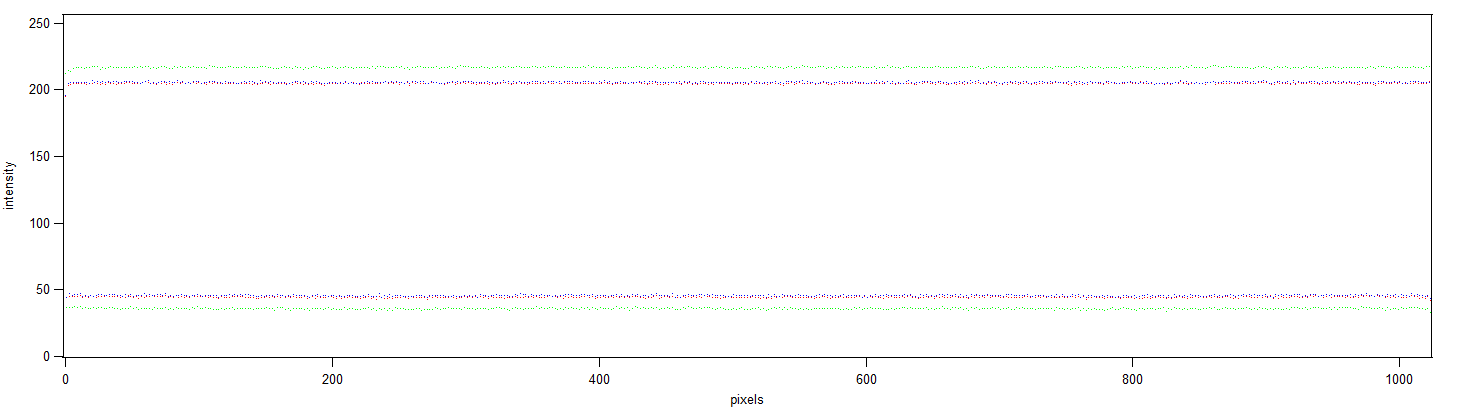
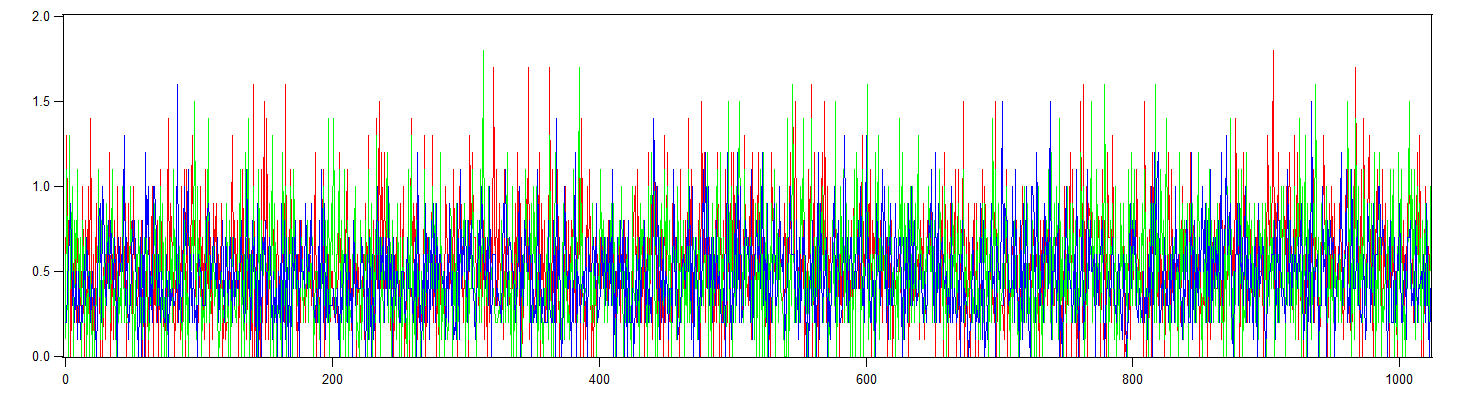
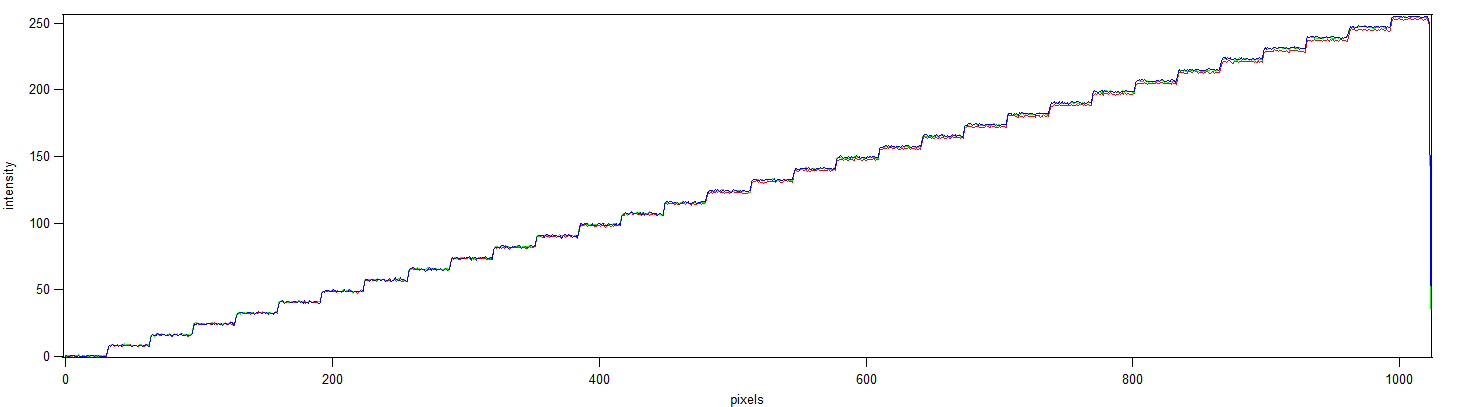
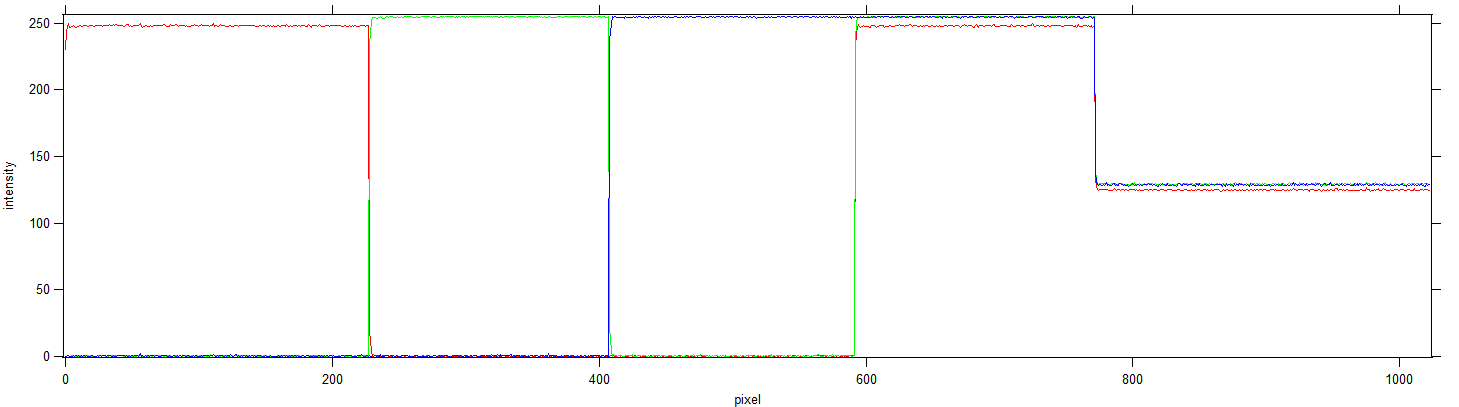
SPEA V7 Mirage P64 (S3 Vision 864)
http://mail.lipsia.de/~enigma/neu/pics/graphi … mirage_p-64.jpg
Used values: Offset 31, Gain 172, Phase 31
Image captured:
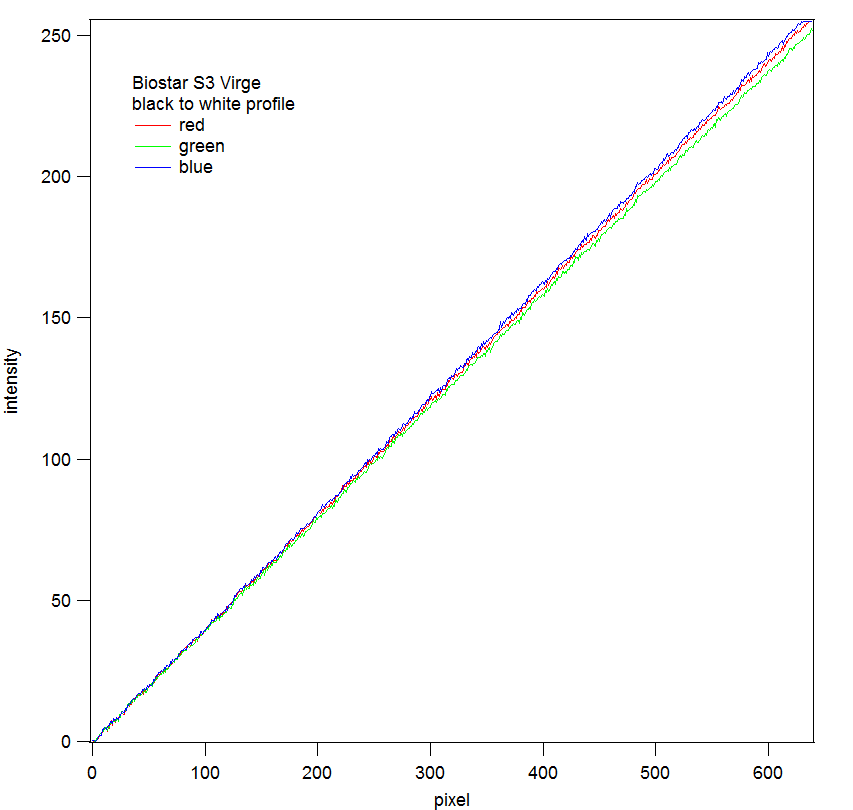
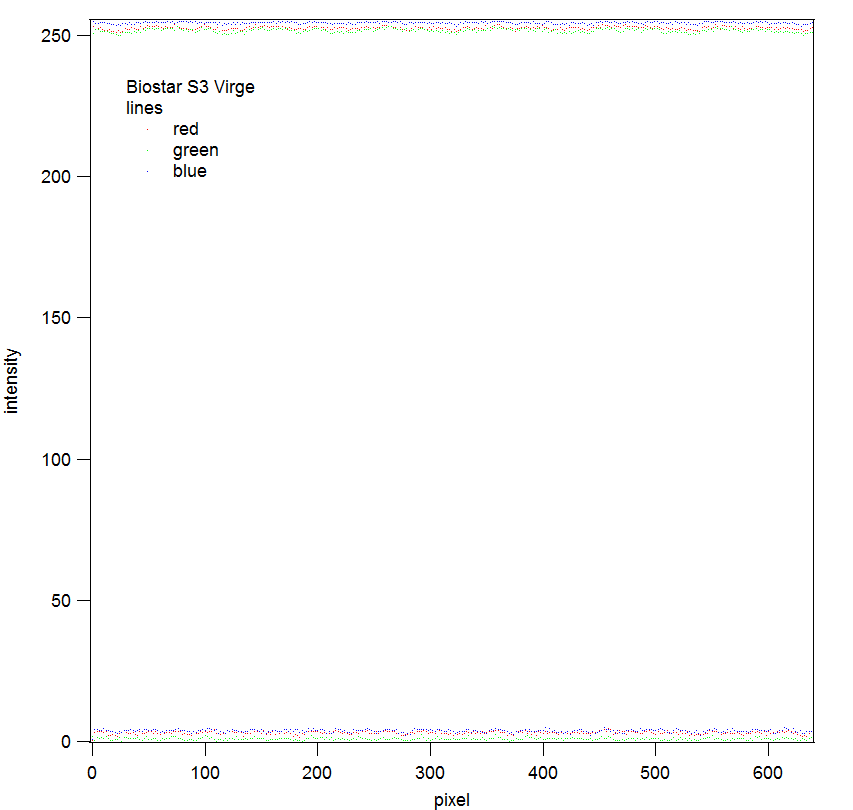
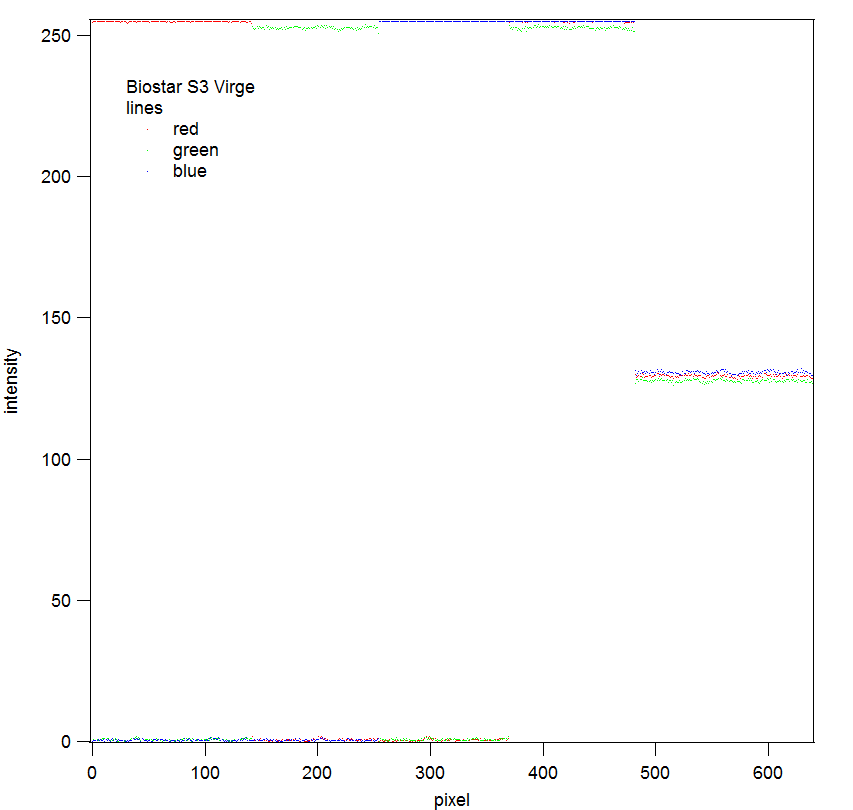
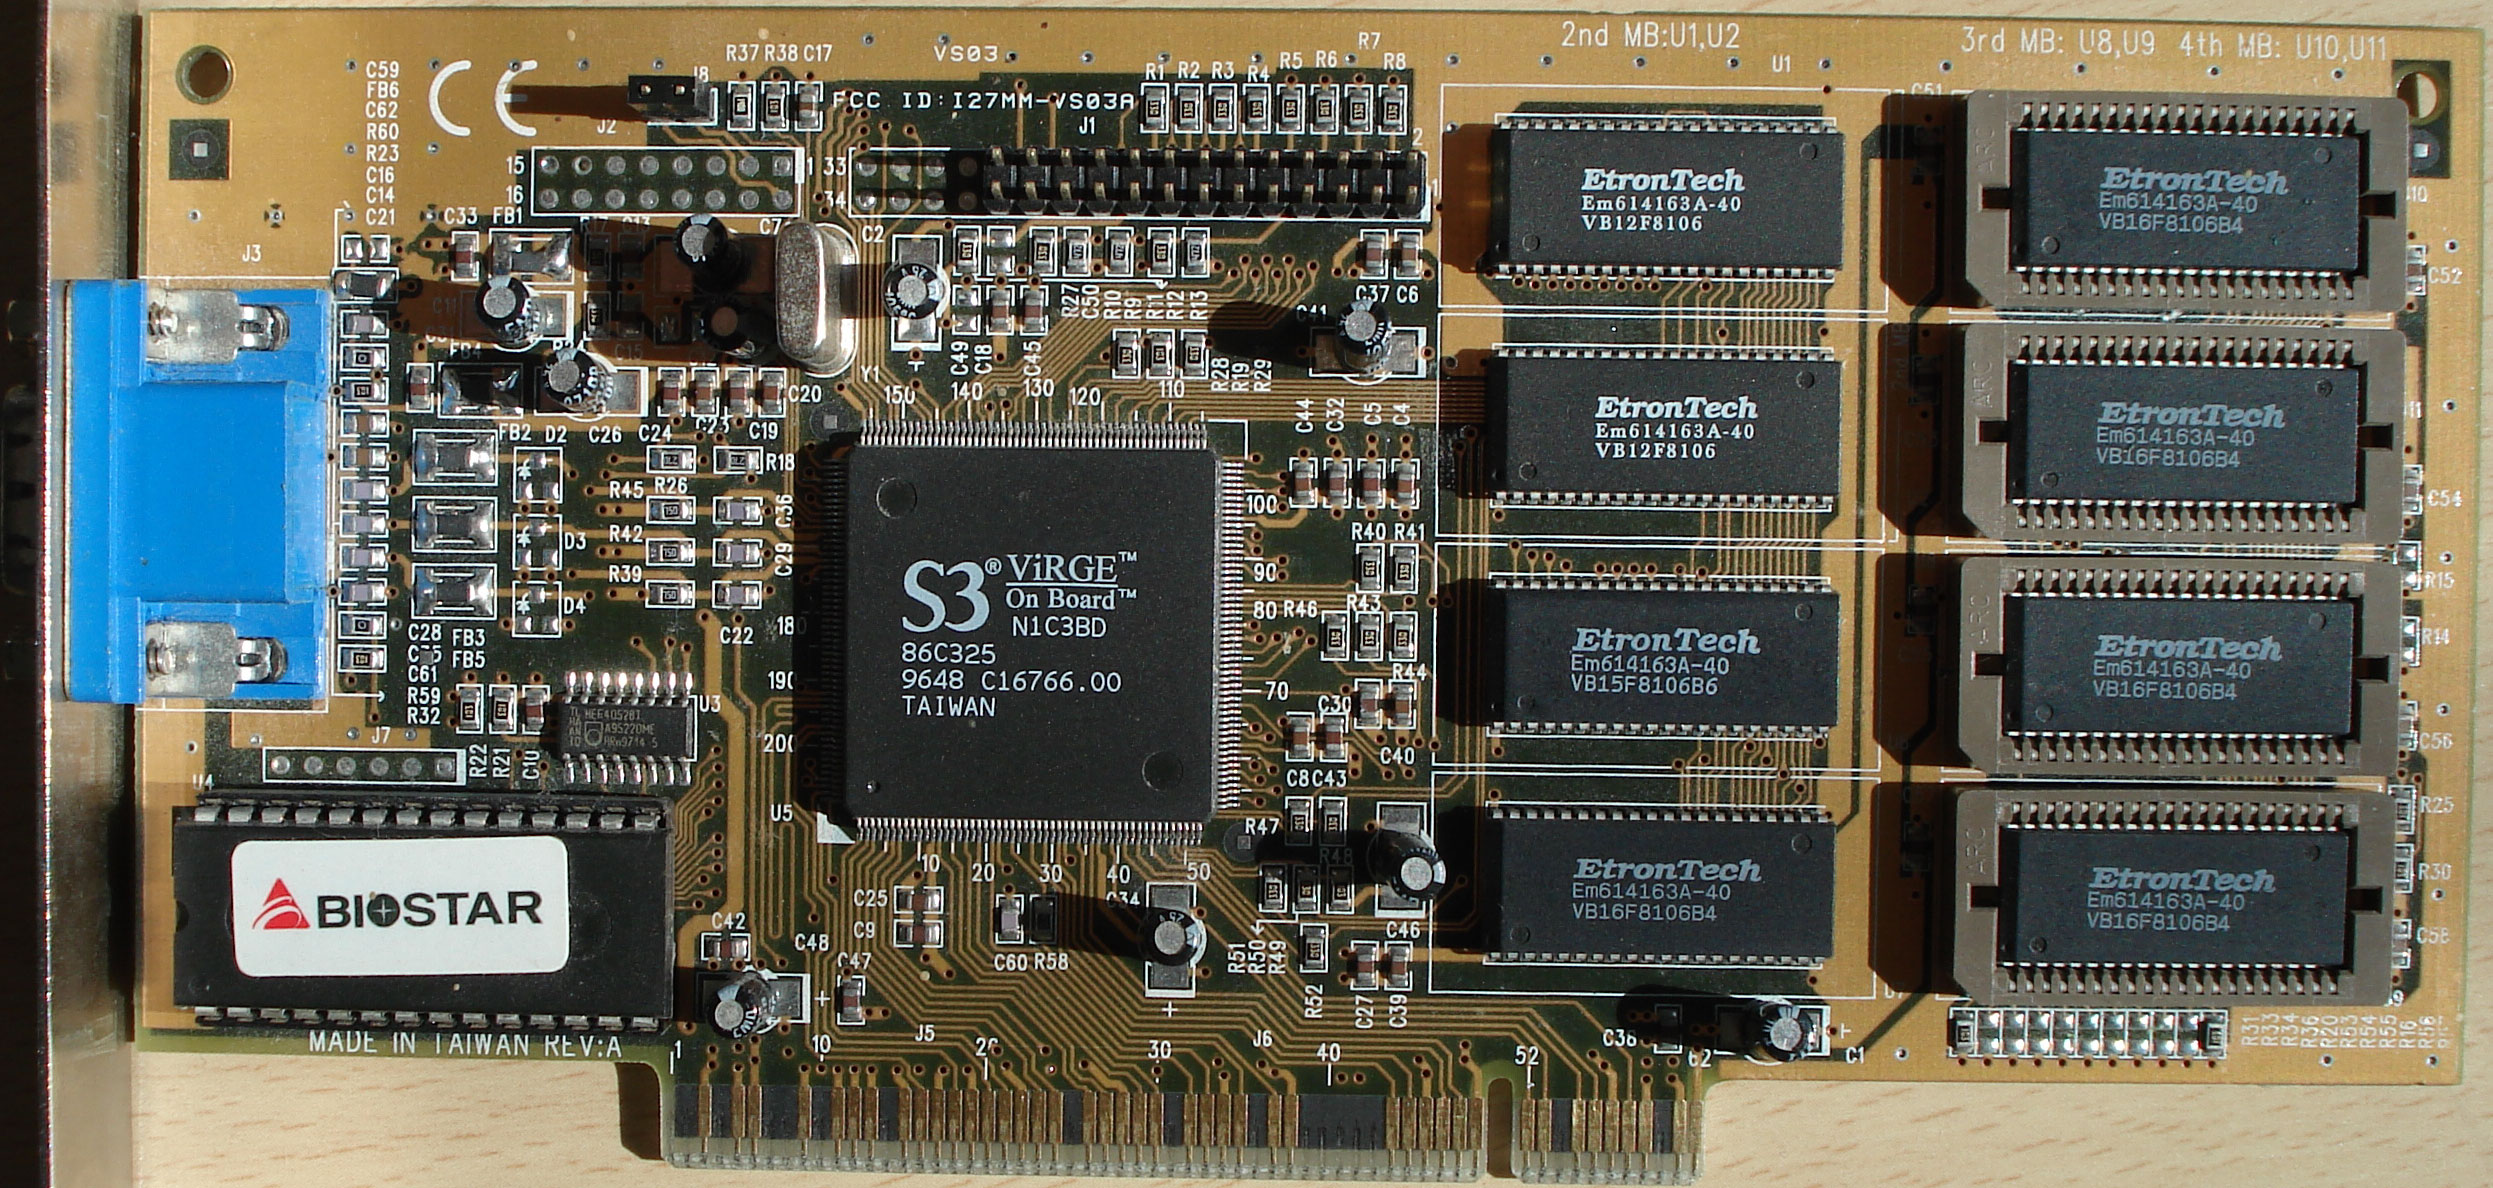
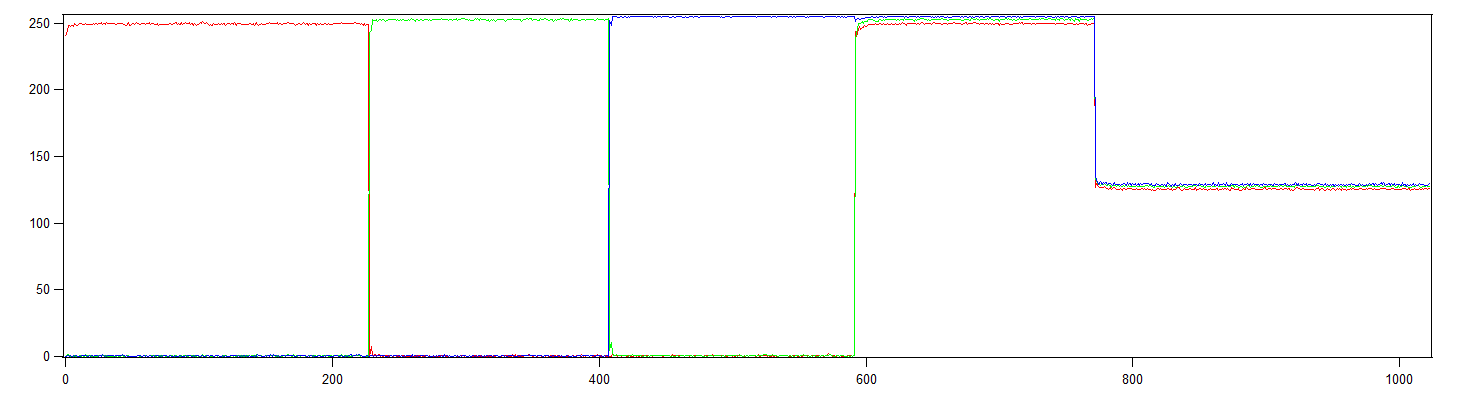
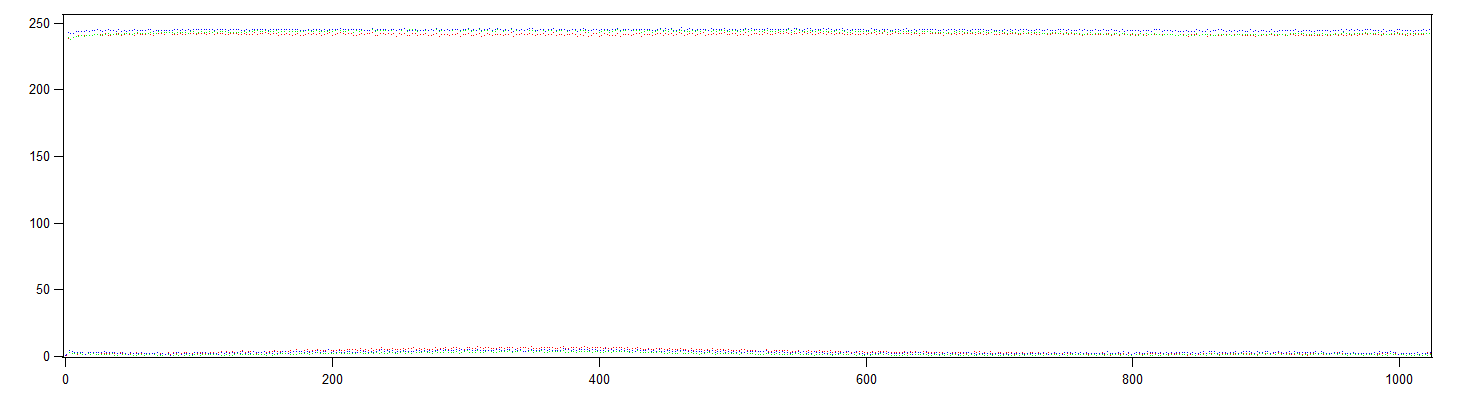
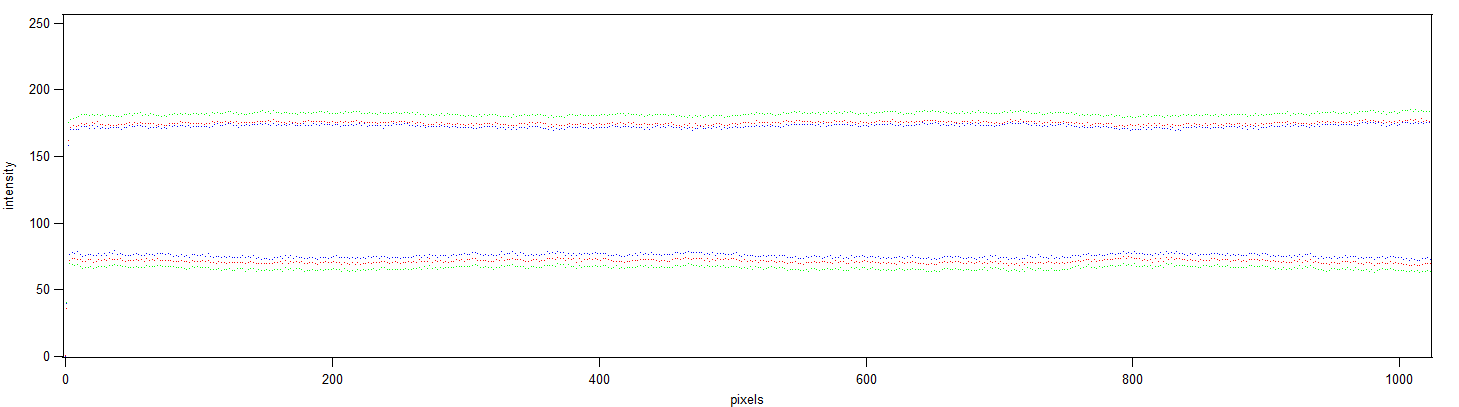
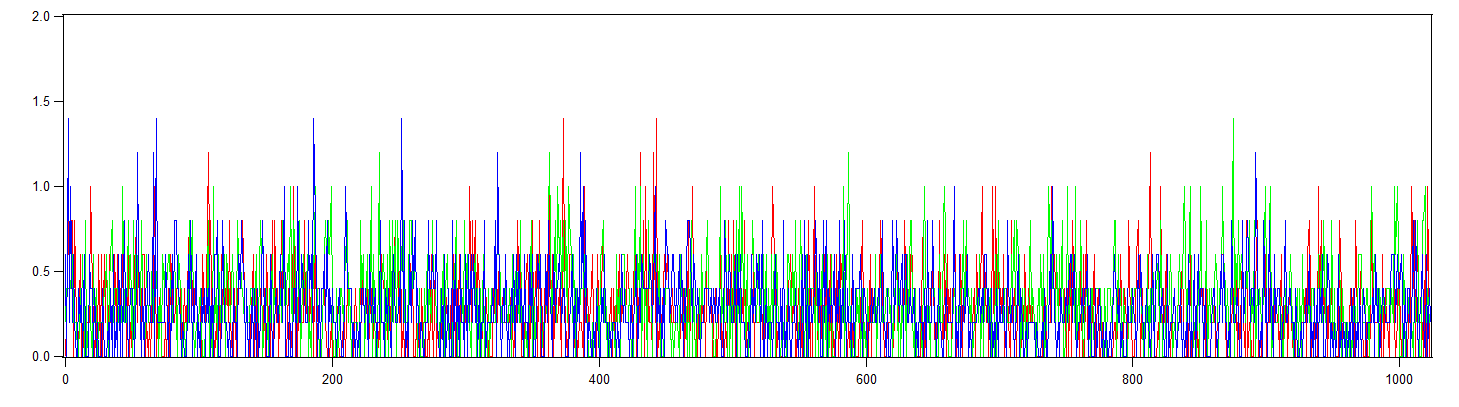
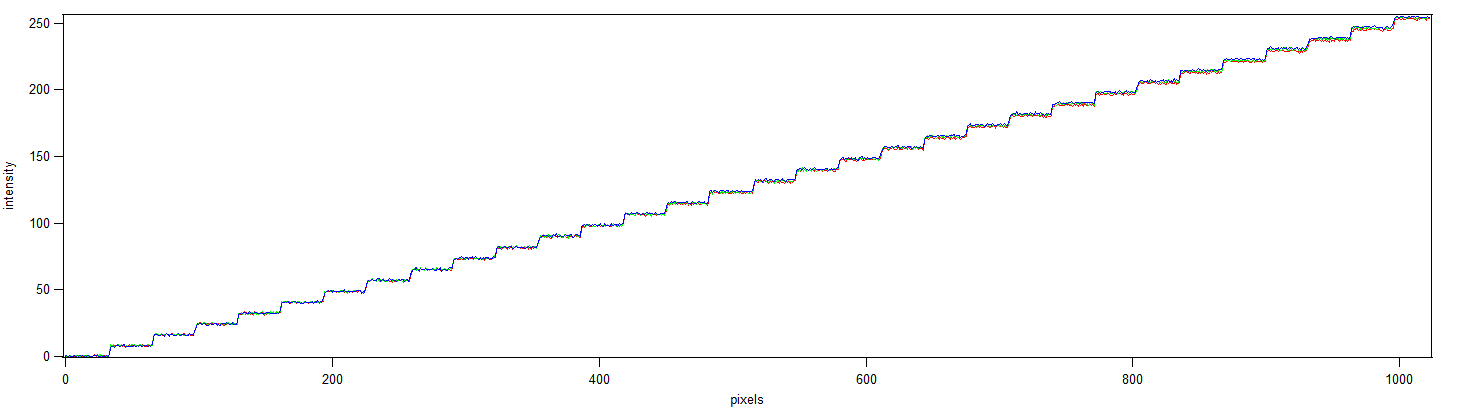
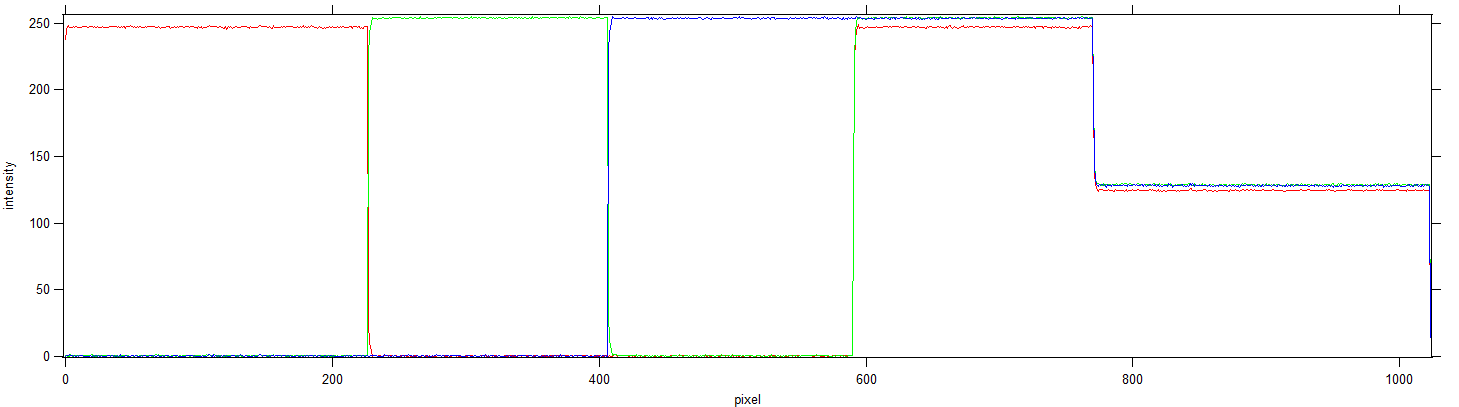
Biostar S3 Virge
http://mail.lipsia.de/~enigma/neu/pics/s3_virge_dx.jpg
Used values: Offset 31, Gain 172, Phase 0
Image captured:

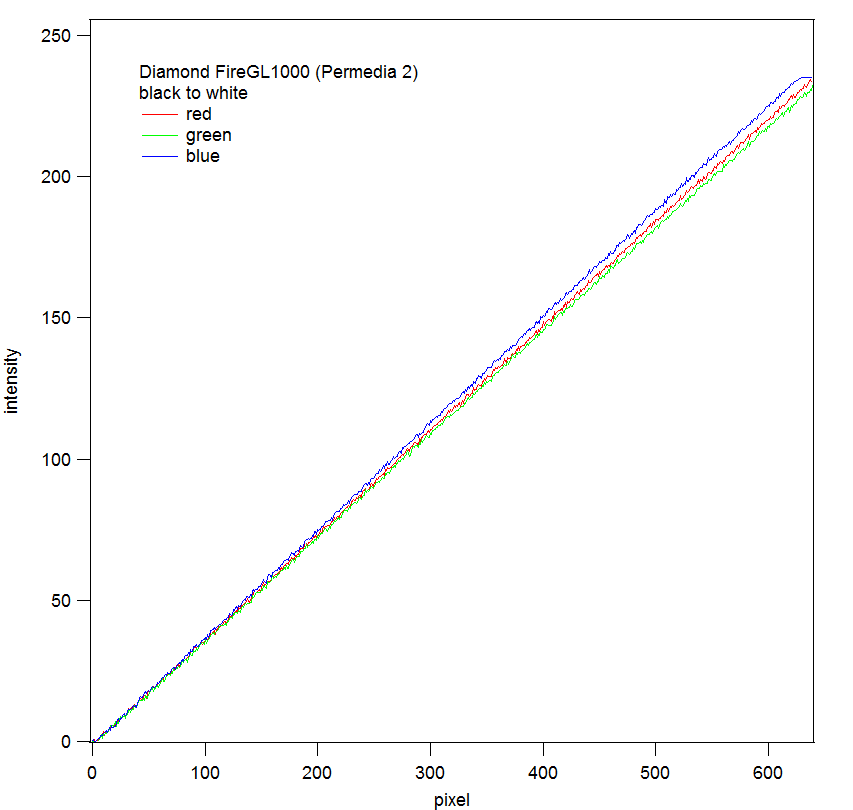
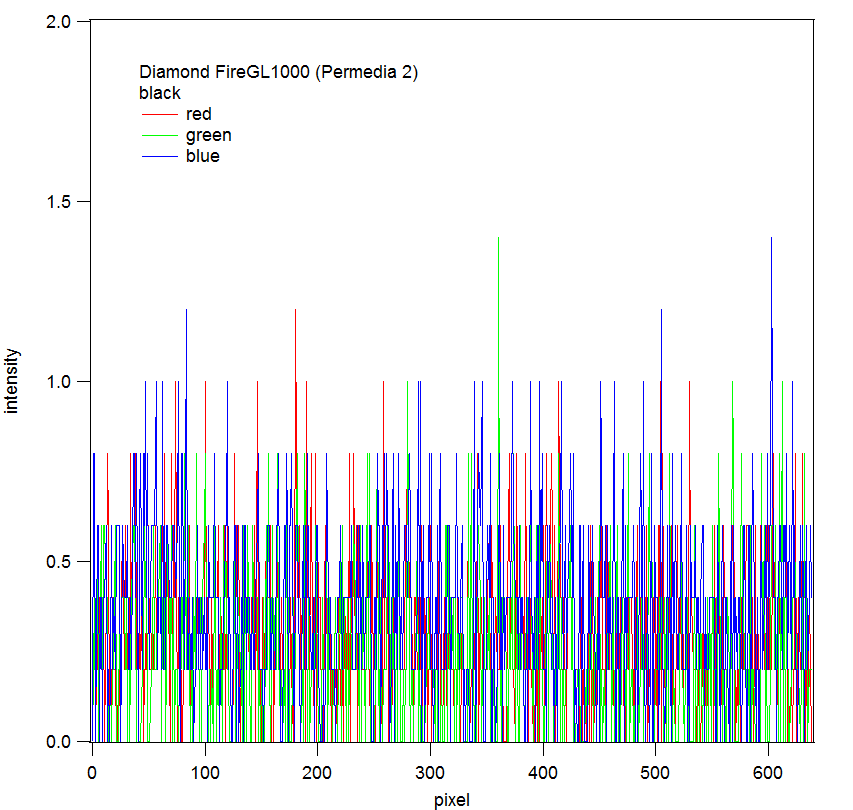
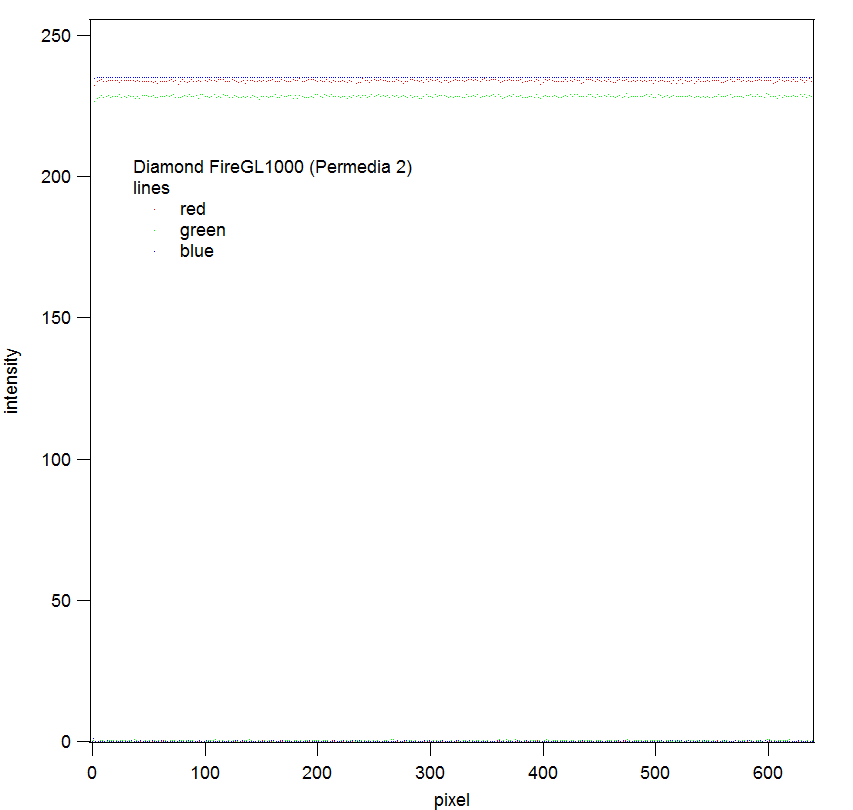
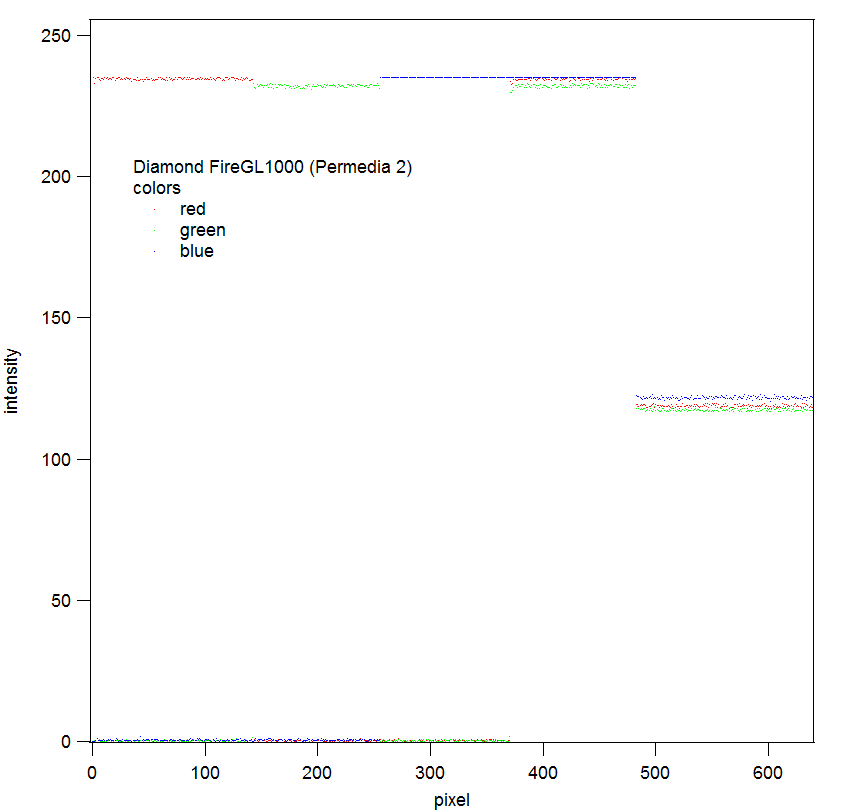
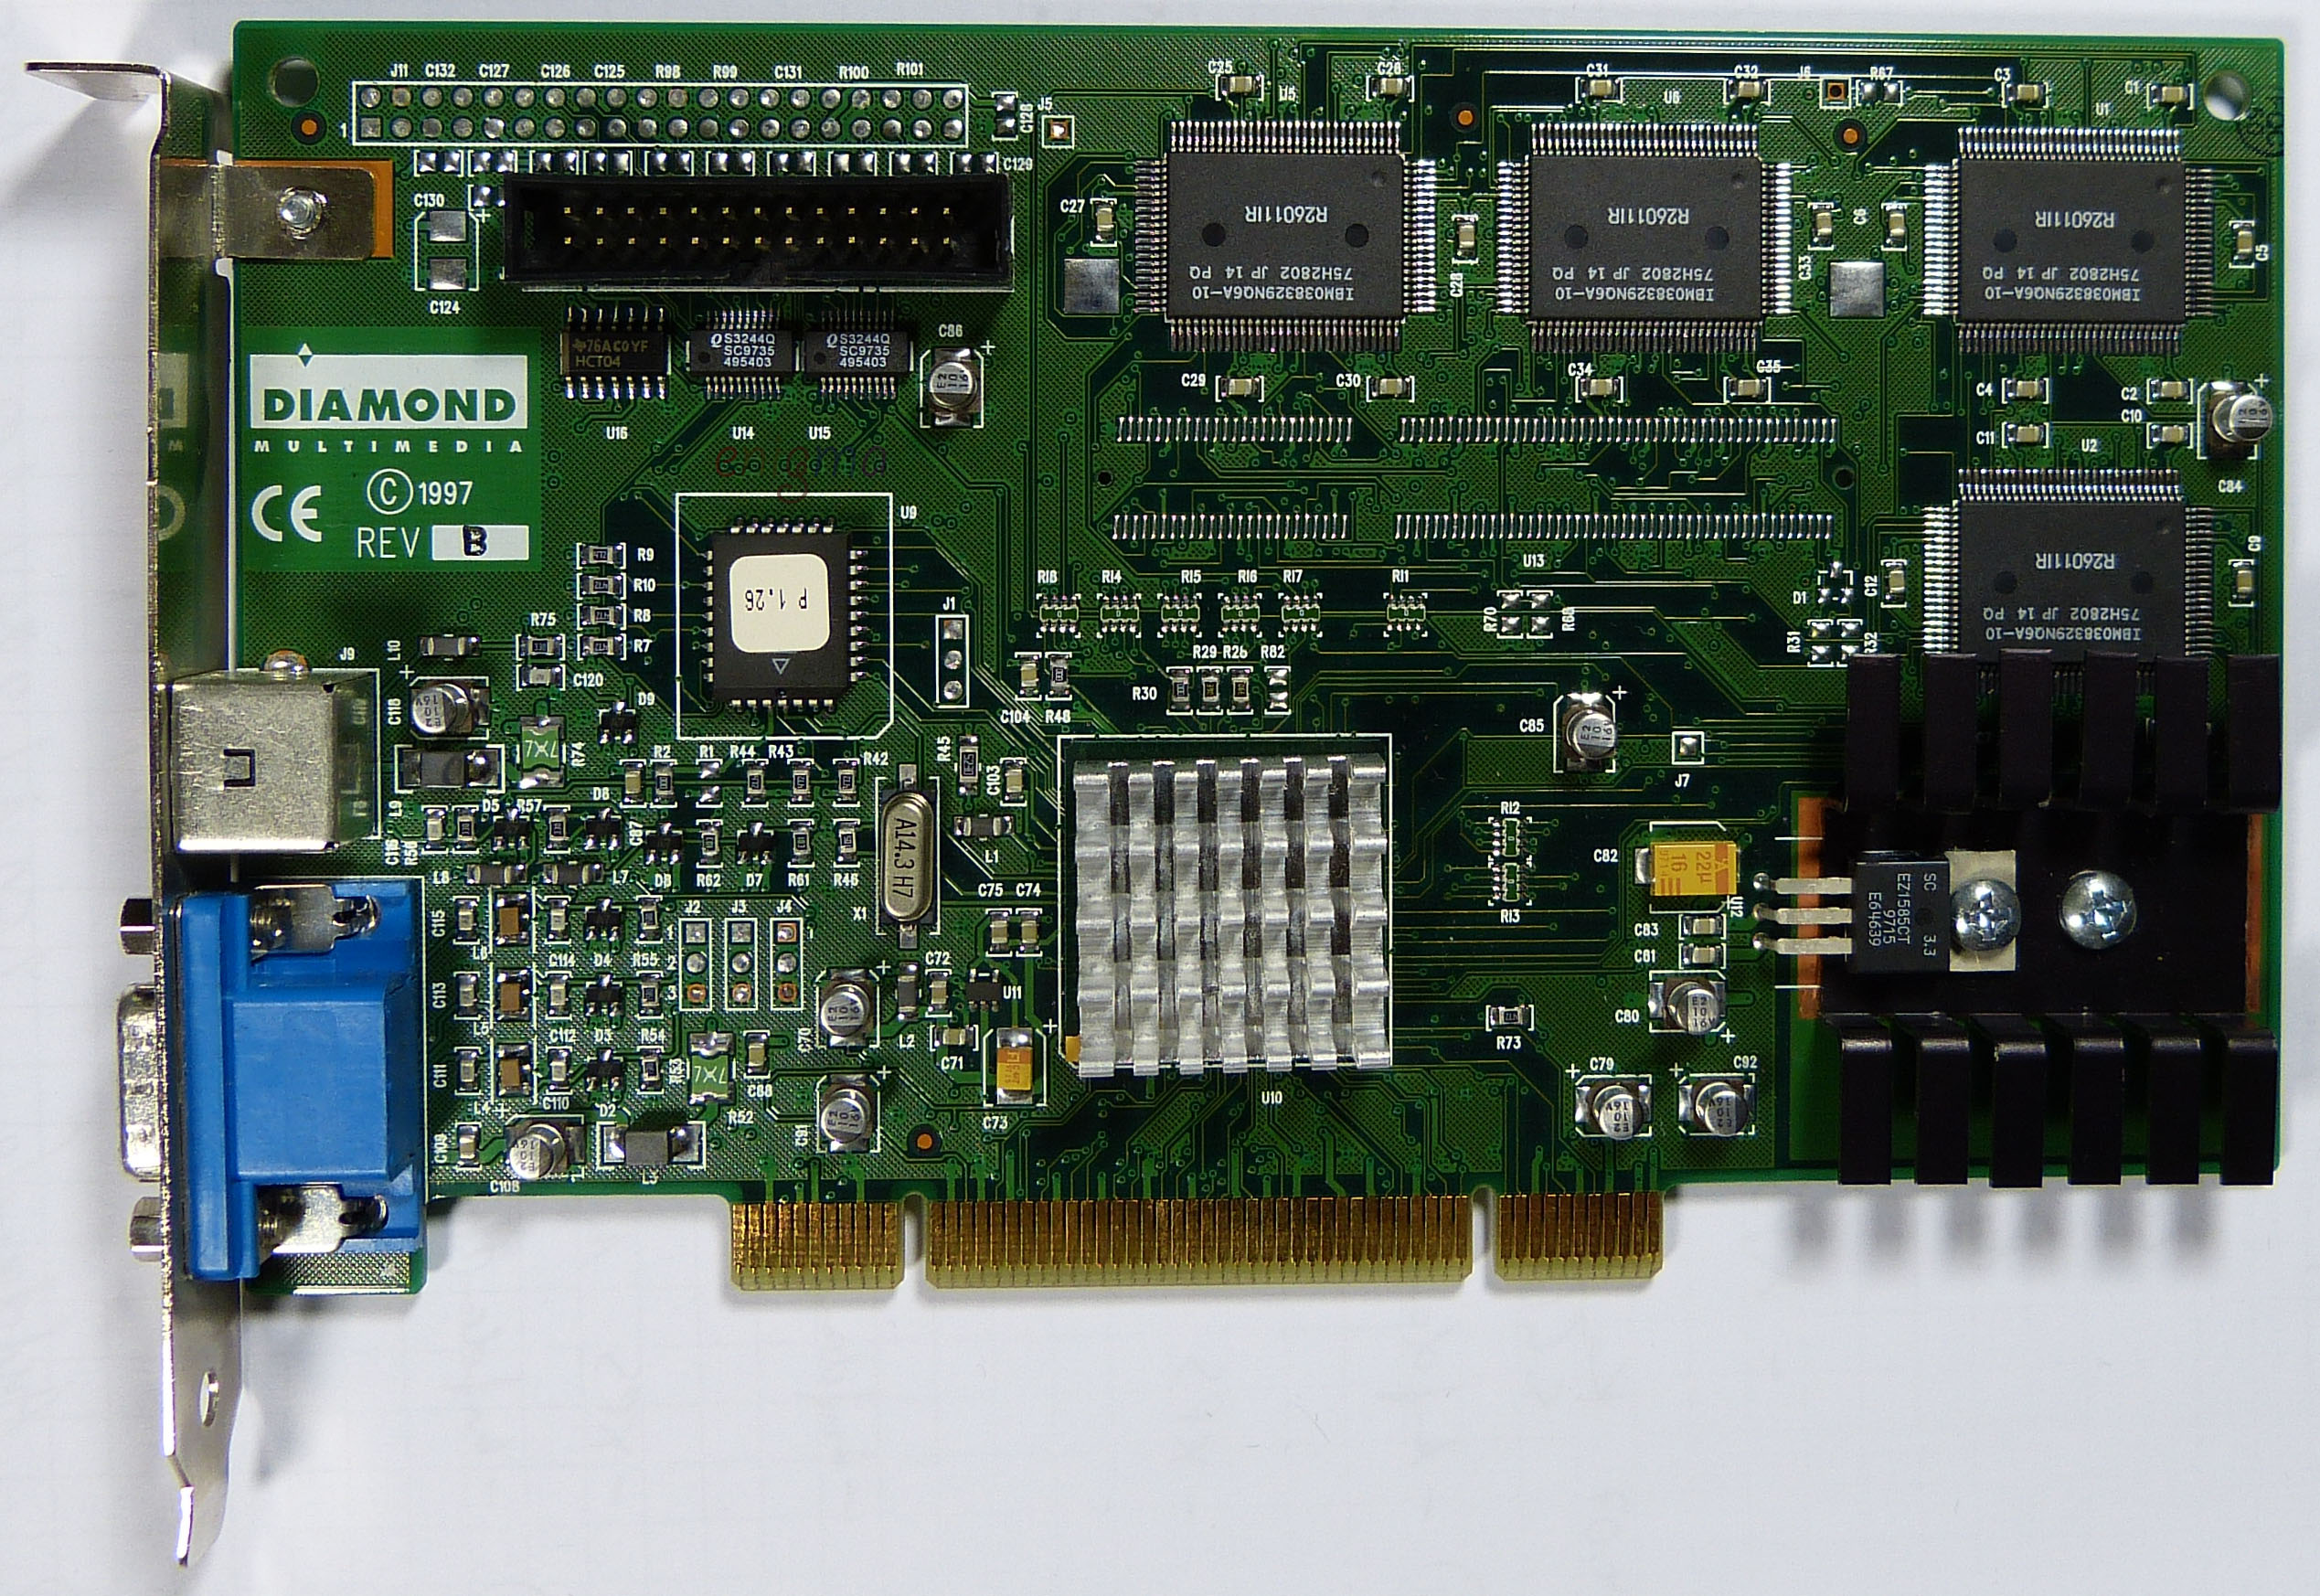
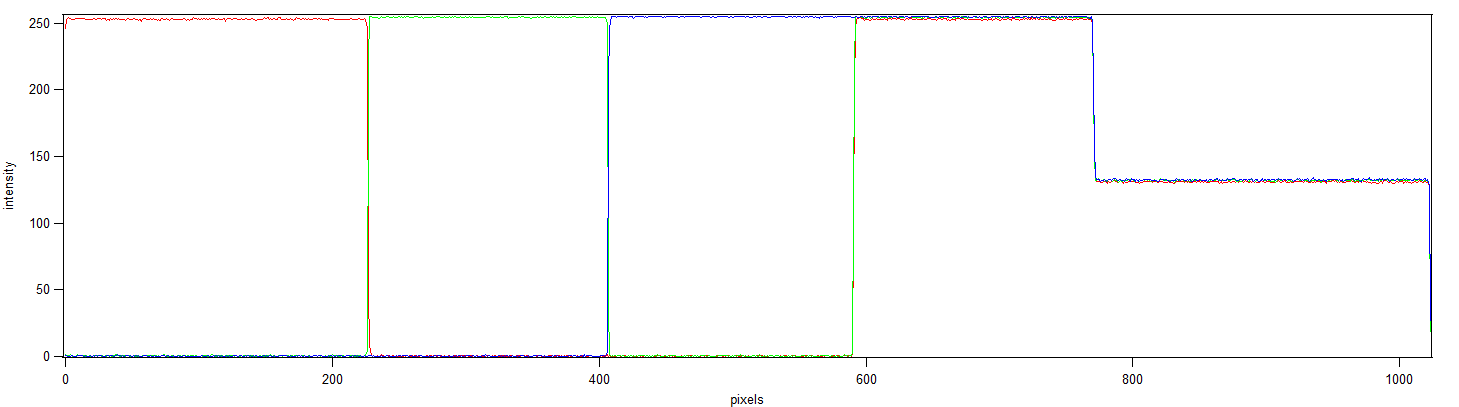
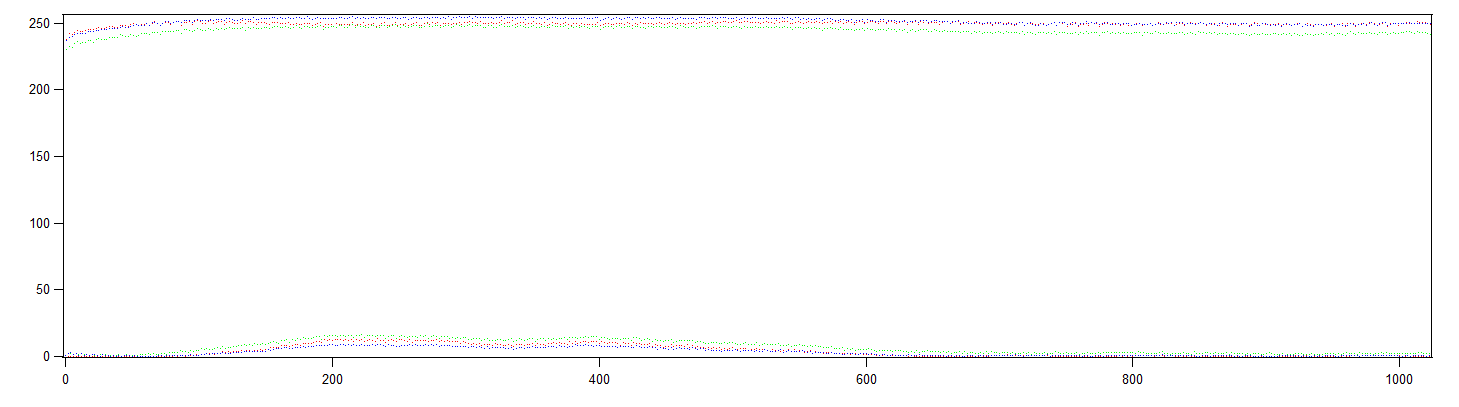
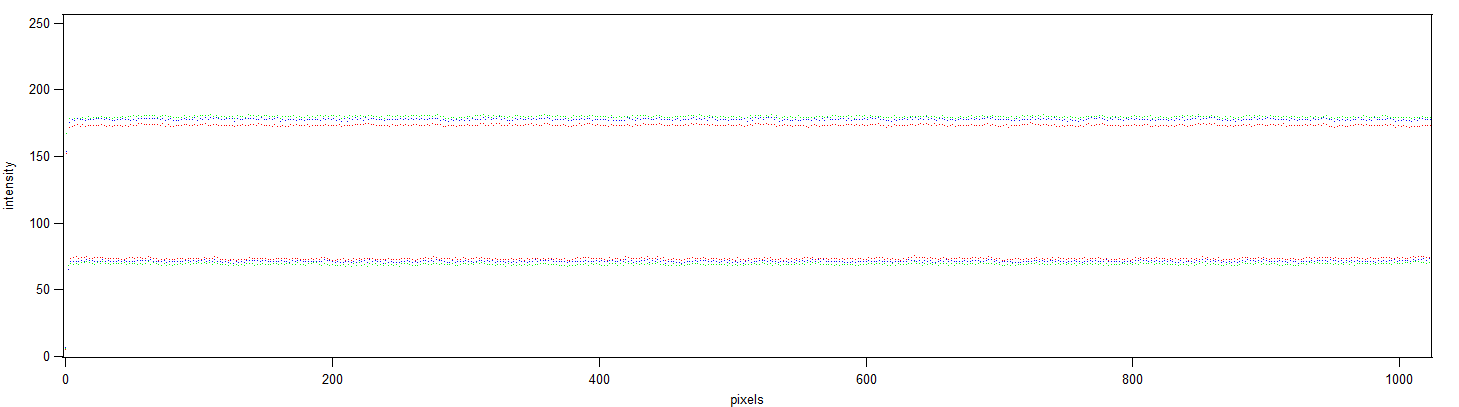
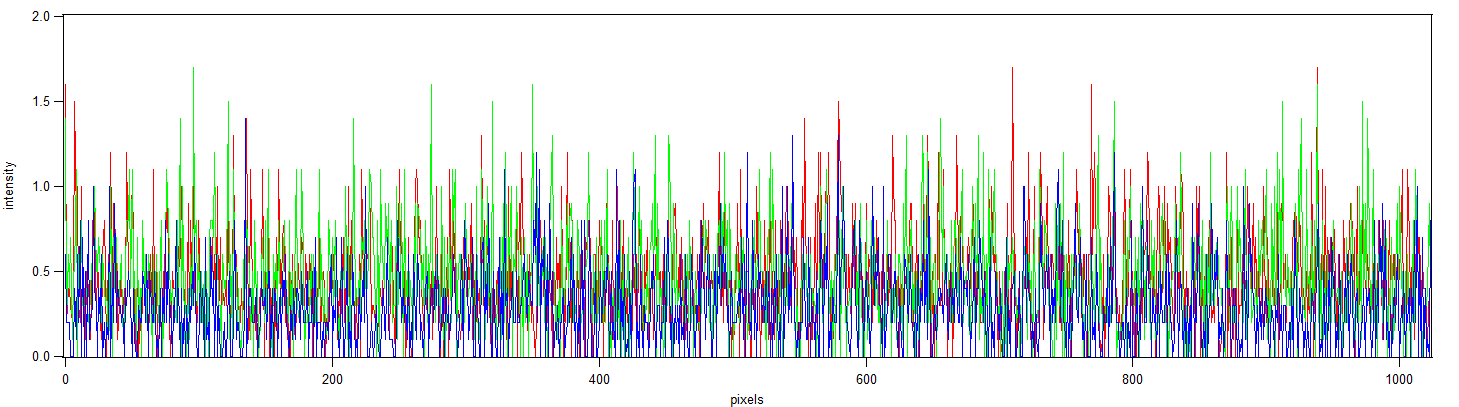
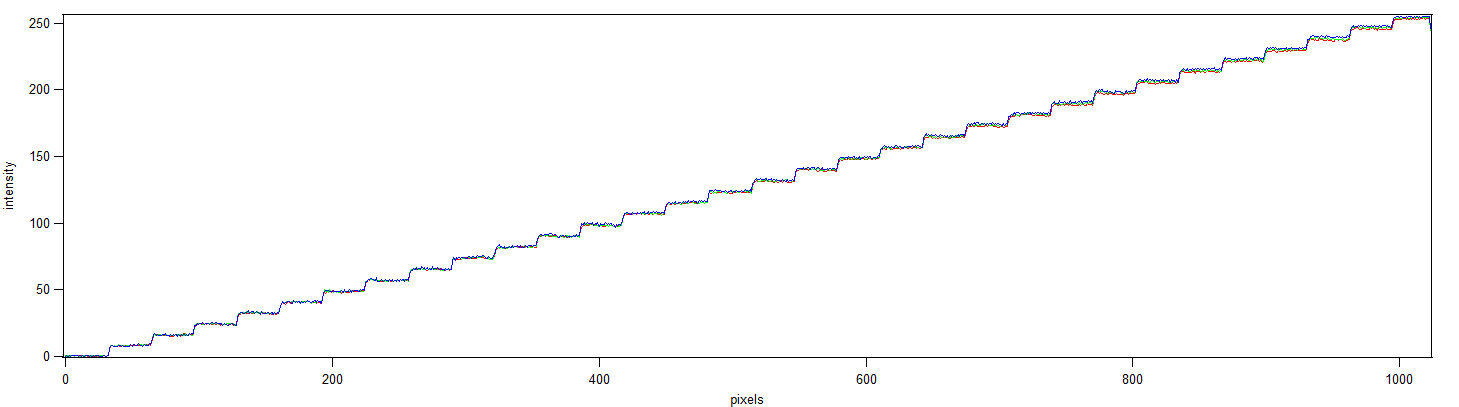
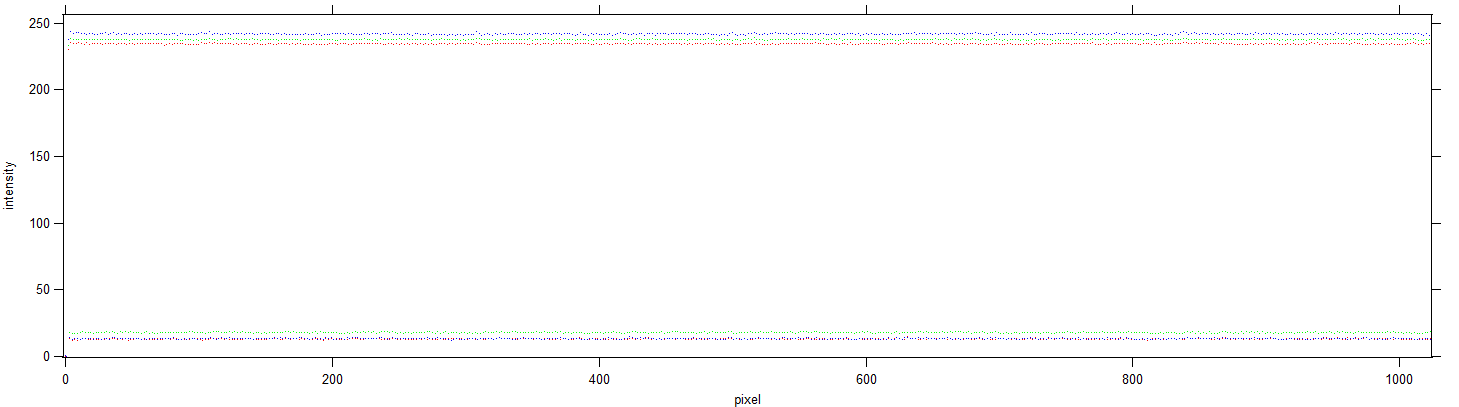
Diamond FireGL 1000 (Permedia 2)
http://mail.lipsia.de/~enigma/neu/pics/diamon … _1k_8mb_pci.jpg
Used values: Offset 36, Gain 191, Phase 31
I didn't hit the white point precisely with this one it's a bit too dark.
Still I didn't wanted to drop these data.
Image captured:

Data: http://mail.lipsia.de/~enigma/neu/graphics_co … /comparison.pxp
You can load this and play with the graphs using Igor Pro (it's 30 days fully functional) from http://www.wavemetrics.com/support/demos.htm
Retronn.de - Vintage Hardware Gallery, Drivers, Guides, Videos. Now with file search
Youtube Channel
FTP Server - Driver Archive and more
DVI2PCIe alignment and 2D image quality measurement tool


