Reply 20 of 32, by PhilsComputerLab

Rank
l33t++
- Rank
- l33t++
I checked it and it didn't update the file on upload due to a filezilla configuration issue.
It is the current version now.
Retronn.de - Vintage Hardware Gallery, Drivers, Guides, Videos. Now with file search
Youtube Channel
FTP Server - Driver Archive and more
DVI2PCIe alignment and 2D image quality measurement tool
Download link asks a password..?
The original link goes to my ftp site because there are multiple files:
https://retronn.de/ftp/align_tool/DVI2PCIe_align.7z
Test images:
https://retronn.de/ftp/align_tool/test1280.bmp
https://retronn.de/ftp/align_tool/test1024.bmp
https://retronn.de/ftp/align_tool/test800.bmp
https://retronn.de/ftp/align_tool/test640.bmp
Use a 32 bit java runtime.
Retronn.de - Vintage Hardware Gallery, Drivers, Guides, Videos. Now with file search
Youtube Channel
FTP Server - Driver Archive and more
DVI2PCIe alignment and 2D image quality measurement tool
New links works, thank you! 😀
A nice tool! Custom mode alignment works also nicely (with HShift/VShift = 0). DVI2PCIe DUO was not supported, it just says "No mode detected !".
Well, when I programmed it the Duo was not out yet. And I don't have a Duo for testing.
Did you also tried the video bandwidth estimation feat?
Retronn.de - Vintage Hardware Gallery, Drivers, Guides, Videos. Now with file search
Youtube Channel
FTP Server - Driver Archive and more
DVI2PCIe alignment and 2D image quality measurement tool
elianda wrote on 2022-07-06, 20:49:Did you also tried the video bandwidth estimation feat?
Not sure what this means or how to?
I have written a description here: http://retronn.de/imports/dvi2pcie_align_tool.html
What it basically does is exploiting the area of alternating black/white lines with a slightly detuned PLL. If the PLL gets detuned it samples e.g. 800 samples over 798 pixels. Thus, the position of the samples shift from black to white to black.
You can try that after adjusting the image with a test image shown, then detune the PLL by 2. Then it shows at the bottom the graph of the signal intensity, that is simply spoken then 800 samples over two pixels (black - white).
From the slope of the signal going from black to white a bandwidth is estimated.
You can try if detuning by +2 or -2 works best. You might also see an influence of the VGA cable used.
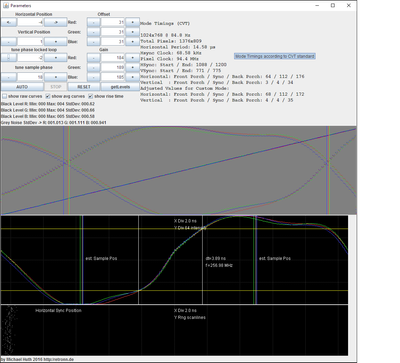
In the example screenshot the PLL is detuned by -2.
In the first plot the Min/Max lines show the transition from black to white and white to black pixels respectively. The perpendicular lines show the crossing that I use for determining the period.
The second plot shows the same data just two half periods concatenated to a full period from black to white and back. The graphs here are averaged over multiple scan lines to reduce the noise.
The tick lines in the background show the time in the x-direction. One division in the example plot is 2ns. In the Y direction the intensity is shown with 64 per division.
The horizontal yellow lines are at 80% of the max/min intensity.
At the crossing of the graph and the yellow lines the white perpendicular lines are drawn. Between the white perpendicular lines the graph changes from 20% to 80% intensity, and the time difference is shown as dt = 3.89 ns that relates to a frequency f of ~257 MHz.
The perpendicular RGB lines show the estimated positions where the DVI2PCIe samples the pixel with non-detuned PLL.
The third plot shows with the white dots at the left the estimated horizontal sync position per scanline. Thus, the distribution shows the HSYNC jitter basically.
Keep in mind that the DVI2PCIe has a limited bandwidth and timing accuracy itself, so the values have error bars.
Though, personally I was impressed that this works quite well and gives reasonable results for different graphics cards.
A general reference is the max. DAC frequency of the connected graphics card.
e.g. S3 Virge 135 MHz etc.
The example image is from a matrox millenium.
Since higher modes have typically more horizontal pixels the curves gets more accurate in the X-direction.
Retronn.de - Vintage Hardware Gallery, Drivers, Guides, Videos. Now with file search
Youtube Channel
FTP Server - Driver Archive and more
DVI2PCIe alignment and 2D image quality measurement tool
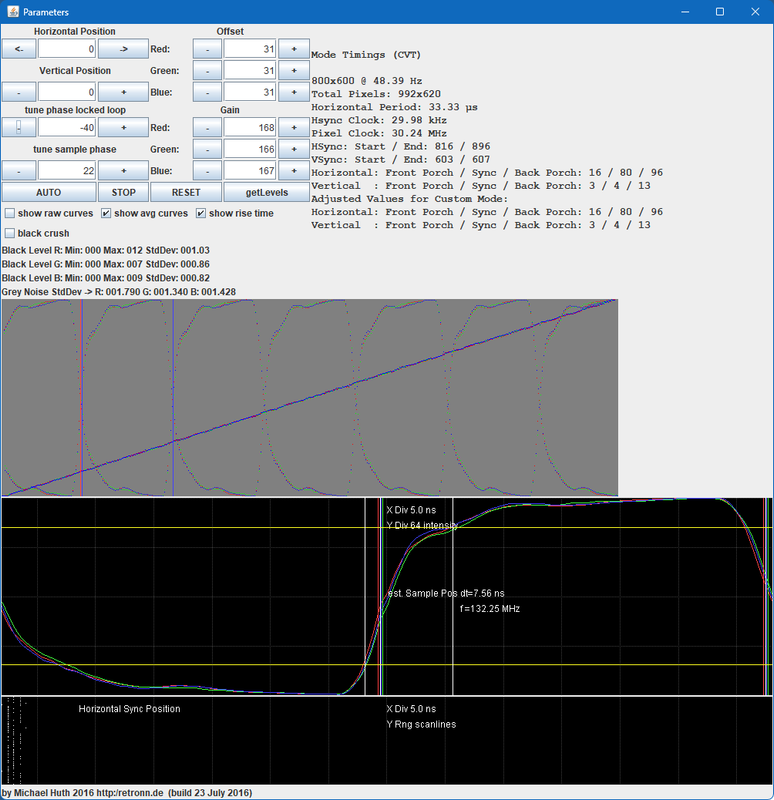
I set the PLL to optimum -38 and pressed the 'getLevels' button. Then II changed the PLL back by -2:
Ok, works 😀
There is one difference though. In the first plot you see 7 half periods. If you tune the PLL offset to see exactly one half period as in my screenshot the accuracy gets much better.
(Sorry there is not automatism here)
Retronn.de - Vintage Hardware Gallery, Drivers, Guides, Videos. Now with file search
Youtube Channel
FTP Server - Driver Archive and more
DVI2PCIe alignment and 2D image quality measurement tool

