VOGONS

Common searches


First post, by Exploit

User metadata
Rank Newbie
Rank
Newbie

I am trying to improve my x86-16 assembler skills and found this nice insight debugger on the FreeDOS 1.3 CD-ROM.
https://www.bttr-software.de/products/insight/

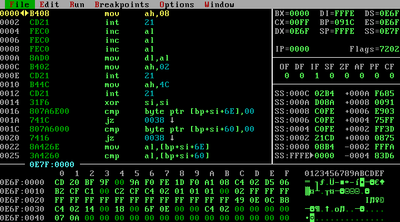
When i load my assembled EXE file in the insight debugger i can see all the correct mnemonic commands in the code window (upper left window), the shown memory address is 0E7F:0000 when the cursor is on the first command which is "mov ah, 08" here. The last command is at 0E7F:0012 and does have the mnemonic "int 21h".
But here's the question, the dump memory window (window at the bottom) is at address 0E6F:0000 and the HEX code shown there doesn't match with the hex code of the code window. See first screenshot for comparsion. (insight.png)

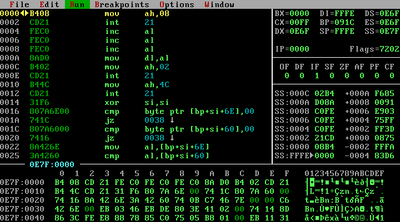
When i do a CTRL+ D search and enter the above address of my code address 0E7F:0000 to go to this address in the "dump memory window", the "dump memory window" shows the correct part of my code. See second screenshot (insight_address_match.png).

Why is this so? Why is the "dumb memory window" showing a completely different memory area/region? Is this a bug of the insight debugger or does this "dump memory window" at the bottom show something other important stuff? If yes, what does it show?

The distance between the Address 0E7F:0000 and 0E6F:0000 is btw. (dec) 274 bytes .

Attachments

  • insight.png
    Filename
    insight.png
    File size
    16.95 KiB
    Views
    605 views
    File license
    Fair use/fair dealing exception
  • insight_address_match.png
    Filename
    insight_address_match.png
    File size
    17.93 KiB
    Views
    605 views
    File license
    Fair use/fair dealing exception

Reply 1 of 5, by jakethompson1

User metadata
Rank Oldbie
Rank
Oldbie

The dump memory window likely intentionally shows a different region of memory depending on whatever you tell it (0E6F:0000 or DS:0000 defaulted to the start of your data segment in this case) and isn't intended to be synchronized with cs:ip. For example, if the current instruction were rep cmpsw, then you care a lot more about looking at a hex dump of ds:si or es:di than your machine code, which you can see anyway to the left of the mnemonics.

Reply 2 of 5, by BloodyCactus

User metadata
Rank Oldbie
Rank
Oldbie

the data segment your seeing is the PSP address, when an EXE loads, es/ds is set to the PSP. only CS:IP, SS:SP are set by the executable.

the PSP is 256 bytes that dos sets up before your exe. so if you add 0x10 to the PSP, your exe starts at 0xE7F:0

--/\-[ Stu : Bloody Cactus :: [ https://bloodycactus.com :: http://kråketær.com ]-/\--

Reply 4 of 5, by doshea

User metadata
Rank Member
Rank
Member
Exploit wrote on 2022-07-11, 00:32:

The distance between the Address 0E7F:0000 and 0E6F:0000 is btw. (dec) 274 bytes .

That debugger looks nice! By the way I hope you noticed by now that this is wrong, the distance is 0x100 (i.e. 0x10 shifted left by 4 bits), i.e. 256 bytes.

Reply 5 of 5, by Exploit

User metadata
Rank Newbie
Rank
Newbie
doshea wrote on 2022-07-11, 03:44:
Exploit wrote on 2022-07-11, 00:32:

The distance between the Address 0E7F:0000 and 0E6F:0000 is btw. (dec) 274 bytes .

That debugger looks nice! By the way I hope you noticed by now that this is wrong, the distance is 0x100 (i.e. 0x10 shifted left by 4 bits), i.e. 256 bytes.

You're correct. My fault.
I have written a small C program that takes a SEGMENT/OFFSET address and transforms it into a linear absolute address and also prints the address value in dec besides the hex value. My fault was, that i started it with the wrong input 0E7F:0012. Didn't notice that. ;(