VOGONS


Emulating Area5150

Topic actions

Reply 40 of 113, by superfury

User metadata
Rank l33t++
Rank
l33t++
GloriousCow wrote on 2023-06-13, 14:45:
root42 wrote on 2023-06-13, 14:03:

Awesome project! Now if someone could fix area5150 so that it runs on my 286, that would be nice 😀 It runs pretty far, but crashes at some point late in the demo.

The 'Wibble' (Charlie Chaplin) and 'Lake' (End credits) effects will never run, unfortunately, as they are perfectly cycle-counted effects that will only run properly on an 8088. Even if they didn't crash, you'd just see spaghetti, if your monitor didn't refuse to sync at all.

Those ran somewhat on UniPCemu.
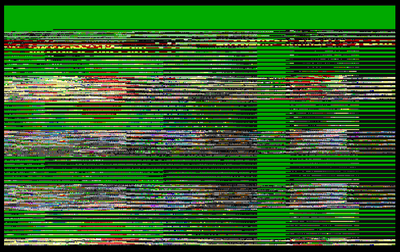
The output seemed stable, the images recognisable, but somehow it looked like the chaplin image was stretched somehow, like being mixed in a very specific way as a sprinkled ghost onto itself. Interestingly the elephant head image part (just the head) is somehow rendered at the top right correctly (with none of the later effects applied to it)? The effects seem to run, but the image looks like it's stretched or copy-pasted onto itself, kind of what happened in UniPCemu during it's early ET4000 VRAM banking formulas and CPU window misbehaving (causing window areas written/read to overlap the same 256K instead of 1MB (like masking off some address bits when reading/writing it shouldn't). Perhaps somehow a related issue? Is anything special wrt VRAM addressing (CPU window or renderer MA) new since 8088 MPH used here?

The credits and effects ran mostly with correct output (stable resolution) during the first UniPCemu test. The main thing there was the horizontal timing (start of scanline rendered it looks like) is off by what seems exactly 1 character clock depending on the scanline number on the screen (once again, the same on every frame). This is seen by output on the scanline shifting left on the screen in a deterministic pattern, same for all frames rendered. Nothing like shaking horizontal timings seems to happen in that part of the demo as far as I can see.

Although UniPCemu currently chokes on both parts, emulating at ~2% realtime speed per second (so 2% of 4.77MHz somehow), probably due to memory calculations and caches (UniPCemu's memory mapping being stressed on the real CPU, causing emulation to become even slower).

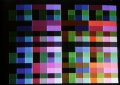
I think the original issue with the overscan should be fixed in the latest commits (the video card precalcs for the overscan color wasn't being applied because the parameter that was indicating to update all color registers (in reality the EGA/VGA attribute controller registers being exploited in the CGA) was being misdetected, thus always updating not a single precalc. I'd assume the same issue might have been with most palette changes on the CGA, but I'm not sure. I didn't have time to check the results yet, but it should have been fixed, as it's working just like on the VGA-compatible cards afaik (the main difference is just the color transformation and NTSC scanline color post-processing added in the CGA (mostly written by Reenigne) or simple 4-bit CLUT for direct colors (again on the whole scanline).
So if the overscan is applied now (it should, due to the precalcs fix), the vector image bouncing and 'getting rid of the overscan' should work fine now.

One interesting thing is I took a short audio capture during the credits and I think it sounded fine. So that should mean that indeed, parts of the credits related to rendering audio should be running correctly and in lockstep with the PIT and PC speaker at least? Perhaps something else is going wrong? What would cause specific parts (as in specific character clock on all frames, at the same CRT position each frame) to affect specific (same on each frame again) scanlines but not others?

Author of the UniPCemu emulator.
UniPCemu Git repository
UniPCemu for Android, Windows, PSP, Vita and Switch on itch.io

Reply 41 of 113, by GloriousCow

User metadata
Rank Member
Rank
Member
superfury wrote on 2023-06-14, 20:16:

Is anything special wrt VRAM addressing (CPU window or renderer MA) new since 8088 MPH used here?

Not really. If you can run the rest of Area5150 I would assume your address handling is correct. The only tricky bit is the little split-frame thing they are doing which I explained in a previous post; but even if you got the addressing wrong for that you'd just see the first character column of the effect being incorrect.

superfury wrote on 2023-06-14, 20:16:

The credits and effects ran mostly with correct output (stable resolution) during the first UniPCemu test. The main thing there was the horizontal timing (start of scanline rendered it looks like) is off by what seems exactly 1 character clock depending on the scanline number on the screen (once again, the same on every frame). This is seen by output on the scanline shifting left on the screen in a deterministic pattern, same for all frames rendered. Nothing like shaking horizontal timings seems to happen in that part of the demo as far as I can see.

Since this effect is cycle-counted, I can only assume that an incrementing start position for successive scanlines might mean you are not executing each lines of effect in exactly 304 cycles. Refer to the image i posted here:
Re: Emulating Area5150 You can see that for the main body of the effect (200 scanlines) CRTC updates should occur at exactly the same raster position each scanline.

I intentionally bumped the effect out of sync here, you can see how even though we are wrapping scanlines now due to C0 overflow, you can kind of see that the ends of each scanline still line up in an orderly fashion.

out_of_sync.PNG
Filename
out_of_sync.PNG
File size
28.39 KiB
Views
1807 views
File comment
Area5150 Lake effect appearance when out of sync.
File license
Public domain

I would recommend setting a breakpoint on the effect ISR (CS:0400). Watch the raster position each time you enter this ISR; it should not jump around severely or slide forwards or backwards. To check your PIT synchronization make sure that exactly 238944 CGA cycles elapse between each interrupt.

superfury wrote on 2023-06-14, 20:16:

One interesting thing is I took a short audio capture during the credits and I think it sounded fine. So that should mean that indeed, parts of the credits related to rendering audio should be running correctly and in lockstep with the PIT and PC speaker at least? Perhaps something else is going wrong? What would cause specific parts (as in specific character clock on all frames, at the same CRT position each frame) to affect specific (same on each frame again) scanlines but not others?

The audio portion of the effect is far more forgiving on cycle timings. during my debugging the audio often sounded fine while the screen was a complete mess.

MartyPC: A cycle-accurate IBM PC/XT emulator | https://github.com/dbalsom/martypc

Reply 42 of 113, by superfury

User metadata
Rank l33t++
Rank
l33t++
GloriousCow wrote on 2023-06-15, 14:24:
Not really. If you can run the rest of Area5150 I would assume your address handling is correct. The only tricky bit is the litt […]
Show full quote
superfury wrote on 2023-06-14, 20:16:

Is anything special wrt VRAM addressing (CPU window or renderer MA) new since 8088 MPH used here?

Not really. If you can run the rest of Area5150 I would assume your address handling is correct. The only tricky bit is the little split-frame thing they are doing which I explained in a previous post; but even if you got the addressing wrong for that you'd just see the first character column of the effect being incorrect.

superfury wrote on 2023-06-14, 20:16:

The credits and effects ran mostly with correct output (stable resolution) during the first UniPCemu test. The main thing there was the horizontal timing (start of scanline rendered it looks like) is off by what seems exactly 1 character clock depending on the scanline number on the screen (once again, the same on every frame). This is seen by output on the scanline shifting left on the screen in a deterministic pattern, same for all frames rendered. Nothing like shaking horizontal timings seems to happen in that part of the demo as far as I can see.

Since this effect is cycle-counted, I can only assume that an incrementing start position for successive scanlines might mean you are not executing each lines of effect in exactly 304 cycles. Refer to the image i posted here:
Re: Emulating Area5150 You can see that for the main body of the effect (200 scanlines) CRTC updates should occur at exactly the same raster position each scanline.

I intentionally bumped the effect out of sync here, you can see how even though we are wrapping scanlines now due to C0 overflow, you can kind of see that the ends of each scanline still line up in an orderly fashion.
out_of_sync.PNG

At the credits, most scanlines line up correctly. It's just some of the scanlines that are shifted one character clock towards the right side of the screen, in a repeating pattern. So that would mean only some specific (think modulo something scanline numbers) scanlines have too few or less CPU clocks? Those shifts don't move vertically, so vsync is consistent?

GloriousCow wrote on 2023-06-15, 14:24:

I would recommend setting a breakpoint on the effect ISR (CS:0400). Watch the raster position each time you enter this ISR; it should not jump around severely or slide forwards or backwards. To check your PIT synchronization make sure that exactly 238944 CGA cycles elapse between each interrupt.

I can check the video's raster position (the renderer's(think CGA programmed register from 0 to vtotal, in raw dot clocks(div 8 for character clock) and scanline counter) as well as the beam's(position on the raster that's drawn during said dot clock), displaying seperately) in UniPCemu (logged and displayed in the on-screen debugger during a breakpoint), but that's all.

GloriousCow wrote on 2023-06-15, 14:24:
superfury wrote on 2023-06-14, 20:16:

One interesting thing is I took a short audio capture during the credits and I think it sounded fine. So that should mean that indeed, parts of the credits related to rendering audio should be running correctly and in lockstep with the PIT and PC speaker at least? Perhaps something else is going wrong? What would cause specific parts (as in specific character clock on all frames, at the same CRT position each frame) to affect specific (same on each frame again) scanlines but not others?

The audio portion of the effect is far more forgiving on cycle timings. during my debugging the audio often sounded fine while the screen was a complete mess.

One question: Does it use interrupts during the credits? That might be related to the off-by-1 character clock?

Author of the UniPCemu emulator.
UniPCemu Git repository
UniPCemu for Android, Windows, PSP, Vita and Switch on itch.io

Reply 43 of 113, by GloriousCow

User metadata
Rank Member
Rank
Member
superfury wrote on 2023-06-17, 07:50:

I can check the video's raster position (the renderer's(think CGA programmed register from 0 to vtotal, in raw dot clocks(div 8 for character clock) and scanline counter) as well as the beam's(position on the raster that's drawn during said dot clock), displaying seperately) in UniPCemu (logged and displayed in the on-screen debugger during a breakpoint), but that's all.

That should be sufficient I'd think.

superfury wrote on 2023-06-17, 07:50:

One question: Does it use interrupts during the credits? That might be related to the off-by-1 character clock?

Yes, thats why I suggested setting a breakpoint on the ISR. The entire effect is interrupt-driven with the PIT set to 19912, this creates an interrupt that occurs exactly at the same position on screen every time, assuming 262 scanlines are produced. If your raster position changes significantly each time you break on the ISR, you have cycle-timing issues.

Does UniPCemu have the means to execute an arbitrary code binary and show the number of cycles elapsed, or do cycle logging?

MartyPC: A cycle-accurate IBM PC/XT emulator | https://github.com/dbalsom/martypc

Reply 44 of 113, by superfury

User metadata
Rank l33t++
Rank
l33t++
GloriousCow wrote on 2023-06-17, 15:44:
That should be sufficient I'd think. […]
Show full quote
superfury wrote on 2023-06-17, 07:50:

I can check the video's raster position (the renderer's(think CGA programmed register from 0 to vtotal, in raw dot clocks(div 8 for character clock) and scanline counter) as well as the beam's(position on the raster that's drawn during said dot clock), displaying seperately) in UniPCemu (logged and displayed in the on-screen debugger during a breakpoint), but that's all.

That should be sufficient I'd think.

superfury wrote on 2023-06-17, 07:50:

One question: Does it use interrupts during the credits? That might be related to the off-by-1 character clock?

Yes, thats why I suggested setting a breakpoint on the ISR. The entire effect is interrupt-driven with the PIT set to 19912, this creates an interrupt that occurs exactly at the same position on screen every time, assuming 262 scanlines are produced. If your raster position changes significantly each time you break on the ISR, you have cycle-timing issues.

Does UniPCemu have the means to execute an arbitrary code binary and show the number of cycles elapsed, or do cycle logging?

It can load any BIOS ROM and run that (loading it at 1MB-size, starting execution at FFFF:0000 on the 8088/8086).
Cycle logging with bus activity is supported. It logs the 'instruction executed' disassembly at it's final cycle, before a new one is starting to fetch(decoded at first/second byte fetched, modr/m etc. Basically whenever something is unknown, decoding happens (takes no cycles, unless known in specific cases, usually at least 1 cycle for any BIU fetch, no matter what it's fetching)). Stuff like modrm decoding takes known cycles. Only documented timings of Reenigne's original emulation project are used, although PIC interrupt handling is just one big EU chunk (besides usual memory accesses).
All instruction timings themselves are mostly as reverse-engineered by Reenigne. Some instructions might have something missing if they're not commonly shared timings with other instructions.
HLT is basically 2 cycles, then 1 cycle until INTR, which will start to read data from RAM, finally followed by some timing for INT (just some NOP EU cycles).

Edit: Just checked INTR timings:
1. Push CS,IP,FLAGS
2. 36 NOP cycles
3. Read CS,IP from IVT.
4. Next instruction starts

That's shared with INT's EU phase of execution (after reading the interrupt number immediate value).

Author of the UniPCemu emulator.
UniPCemu Git repository
UniPCemu for Android, Windows, PSP, Vita and Switch on itch.io

Reply 45 of 113, by GloriousCow

User metadata
Rank Member
Rank
Member
superfury wrote on 2023-06-17, 19:28:

It can load any BIOS ROM and run that (loading it at 1MB-size, starting execution at FFFF:0000 on the 8088/8086).

What I found useful is loading an arbitrary binary blob at a specified location and running it directly. The way I know when to stop is if there is a fetch for a code byte outside of the range of the binary or BIOS area. This means the binary can't do anything fancy like decompress itself or copy code around and jump there, but you could do something more sophisticated like have the code terminate on a service interrupt or special opcode if you needed that.

In any case, the utility of this is being able to get cycle traces of specific pieces of code without having to boot the entire system. I pulled out the entire Lake effect ISR out and ran it through my validator that way. Otherwise you'd need some facility to start and stop cycle logging between two specified breakpoints to measure how long that code was taking.

superfury wrote on 2023-06-17, 19:28:
Cycle logging with bus activity is supported. It logs the 'instruction executed' disassembly at it's final cycle, before a new o […]
Show full quote

Cycle logging with bus activity is supported. It logs the 'instruction executed' disassembly at it's final cycle, before a new one is starting to fetch(decoded at first/second byte fetched, modr/m etc. Basically whenever something is unknown, decoding happens (takes no cycles, unless known in specific cases, usually at least 1 cycle for any BIU fetch, no matter what it's fetching)). Stuff like modrm decoding takes known cycles. Only documented timings of Reenigne's original emulation project are used, although PIC interrupt handling is just one big EU chunk (besides usual memory accesses).
All instruction timings themselves are mostly as reverse-engineered by Reenigne. Some instructions might have something missing if they're not commonly shared timings with other instructions.
HLT is basically 2 cycles, then 1 cycle until INTR, which will start to read data from RAM, finally followed by some timing for INT (just some NOP EU cycles).

Edit: Just checked INTR timings:
1. Push CS,IP,FLAGS
2. 36 NOP cycles
3. Read CS,IP from IVT.
4. Next instruction starts

That's shared with INT's EU phase of execution (after reading the interrupt number immediate value).

This description has me a bit concerned. Your INTR is a bit backwards; the IVT is read first, FLAGS is pushed, and then CS (FARCALL2), then IP (NEARCALL). Why 36 NOP cycles? There are no NOP cycles in the microcode program for INTR. The timing is mostly driven by the time for bus access and fetching. There are a few cycles spent in the microcode that you would need to account for in addition, but not 36 of them...

Here's the breakdown of my INTR:
1. Execute 1 cycle depending on parameter flag (certain interrupt types will jump past the first microcode instruction of INTR)
2. Execute 2 cycles (calculating the IVR IND)
3. Read IP (taking as many cycles as BIU dictates)
4. Read CS
5. Execute 2 cycles - Suspend prefetching and clear Interrupt and Trap Flags
6. Push FLAGS (taking as many cycles as BIU dictates)
7. Execute 2 cycles - Jump to FARCALL2

FARCALL2:
1. Execute 2 cycles - Correct PC
2. Push CS to stack
3. Execute 3 cycles - jump to NEARCALL

NEARCALL:
1. Execute 3 cycles - FLUSH queue
2. Push IP

so just a rough count that's bus access time + 15 cycles for INTR.

MartyPC: A cycle-accurate IBM PC/XT emulator | https://github.com/dbalsom/martypc

Reply 46 of 113, by mills26

User metadata
Rank Newbie
Rank
Newbie

Sorry if this is a dumb question... Does the credits scene in area5150 need a real (or emulated) CRT to look ok?.

I have been testing an 8088 clone made in FPGA (it's called PCXT). Area5150 and 8088mph are now running near perfect. This FPGA outputs VGA, and I'm testing it via VGA->LCD monitor (I don't have a CRT to test now).

The final area5150 scenes look like garbage, and I suspect the LCD monitor is unable to cope with so many crt register changes. This FPGA clone can't output an emulated CRT to a buffer and then send the image to a screen, it just sends raw VGA data.

A VGA demo called copper (which uses crt registers to create waves) does work on another clone (ao486) if you connect the fpga to a real crt.

Reply 47 of 113, by reenigne

User metadata
Rank Oldbie
Rank
Oldbie

No, it should look fine on an LCD monitor. In fact the monitor shouldn't be able to tell that there are any CRT register changes - if everything is working correctly the signal to the monitor should look like a very standard CGA signal (except for the visuals in the overscan area, on effects that do that).
It's extremely unlikely that anything that makes any claim of VGA compatibility will work with Area 5150, though. VGA has very different timings to CGA (31.5kHz vs 15.7kHz horizontal and 70Hz vs 59.92Hz vertical) so synchronising the CPU with the raster beam isn't going to work. If the FPGA simulated a CGA with cycle-accurate timings and then did a separate scan conversation to VGA, that's the only way it could work.

Reply 48 of 113, by mills26

User metadata
Rank Newbie
Rank
Newbie
reenigne wrote on 2023-06-19, 10:56:

No, it should look fine on an LCD monitor. In fact the monitor shouldn't be able to tell that there are any CRT register changes - if everything is working correctly the signal to the monitor should look like a very standard CGA signal (except for the visuals in the overscan area, on effects that do that).
It's extremely unlikely that anything that makes any claim of VGA compatibility will work with Area 5150, though. VGA has very different timings to CGA (31.5kHz vs 15.7kHz horizontal and 70Hz vs 59.92Hz vertical) so synchronising the CPU with the raster beam isn't going to work. If the FPGA simulated a CGA with cycle-accurate timings and then did a separate scan conversation to VGA, that's the only way it could work.

The only parts not working are the two wavy images at the end (the one with the green guy, and the credits). Maybe this core really makes a separate scan conversation to VGA (I don't really know for now) so it is a problem of the simulated CGA.

Thanks!.

Reply 49 of 113, by reenigne

User metadata
Rank Oldbie
Rank
Oldbie

Yeah, those two effects are the most timing-sensitive in the whole demo. Unless it's a cycle-exact emulation of the 8088 at 4.77MHz and the IBM CGA with its particular wait states, both driven from the same time source, they won't work.

Reply 50 of 113, by GloriousCow

User metadata
Rank Member
Rank
Member
mills26 wrote on 2023-06-19, 11:19:

The only parts not working are the two wavy images at the end (the one with the green guy, and the credits). Maybe this core really makes a separate scan conversation to VGA (I don't really know for now) so it is a problem of the simulated CGA.
Thanks!.

It does; you can look at the code for it here. https://github.com/spark2k06/PCXT_MiSTer/tree/main/rtl/video

When your MiSTer changes video modes, you'll see the source mode and converted output presented together like this:

mister_conversion.PNG
Filename
mister_conversion.PNG
File size
112.41 KiB
Views
1612 views
File comment
MiSTer signal conversion display
File license
Public domain

What I think is more likely, actually, is that the MCL 8088 core is not 100% accurate. Just my suspicion without any hard evidence, really... We've seen that it is possible to pass the CPU check in 8088MPH and run the Kefrens bars effect exactly and still fall down on the new BIU delay states encountered in those two effects in Area 5150. They use a wider variety of opcodes and the effect itself is more dynamic than Kefrens. What is "good enough" for 8088MPH may not be good enough for Area 5150.

MartyPC: A cycle-accurate IBM PC/XT emulator | https://github.com/dbalsom/martypc

Reply 51 of 113, by mills26

User metadata
Rank Newbie
Rank
Newbie
GloriousCow wrote on 2023-06-19, 13:31:
It does; you can look at the code for it here. https://github.com/spark2k06/PCXT_MiSTer/tree/main/rtl/video […]
Show full quote
mills26 wrote on 2023-06-19, 11:19:

The only parts not working are the two wavy images at the end (the one with the green guy, and the credits). Maybe this core really makes a separate scan conversation to VGA (I don't really know for now) so it is a problem of the simulated CGA.
Thanks!.

It does; you can look at the code for it here. https://github.com/spark2k06/PCXT_MiSTer/tree/main/rtl/video

When your MiSTer changes video modes, you'll see the source mode and converted output presented together like this:
mister_conversion.PNG

What I think is more likely, actually, is that the MCL 8088 core is not 100% accurate. Just my suspicion without any hard evidence, really... We've seen that it is possible to pass the CPU check in 8088MPH and run the Kefrens bars effect exactly and still fall down on the new BIU delay states encountered in those two effects in Area 5150. They use a wider variety of opcodes and the effect itself is more dynamic than Kefrens. What is "good enough" for 8088MPH may not be good enough for Area 5150.

Thanks, that's right, that fpga cpu is sometimes like 4.66 Mhz.

Reply 52 of 113, by superfury

User metadata
Rank l33t++
Rank
l33t++
GloriousCow wrote on 2023-06-18, 17:02:
What I found useful is loading an arbitrary binary blob at a specified location and running it directly. The way I know when to […]
Show full quote
superfury wrote on 2023-06-17, 19:28:

It can load any BIOS ROM and run that (loading it at 1MB-size, starting execution at FFFF:0000 on the 8088/8086).

What I found useful is loading an arbitrary binary blob at a specified location and running it directly. The way I know when to stop is if there is a fetch for a code byte outside of the range of the binary or BIOS area. This means the binary can't do anything fancy like decompress itself or copy code around and jump there, but you could do something more sophisticated like have the code terminate on a service interrupt or special opcode if you needed that.

In any case, the utility of this is being able to get cycle traces of specific pieces of code without having to boot the entire system. I pulled out the entire Lake effect ISR out and ran it through my validator that way. Otherwise you'd need some facility to start and stop cycle logging between two specified breakpoints to measure how long that code was taking.

superfury wrote on 2023-06-17, 19:28:
Cycle logging with bus activity is supported. It logs the 'instruction executed' disassembly at it's final cycle, before a new o […]
Show full quote

Cycle logging with bus activity is supported. It logs the 'instruction executed' disassembly at it's final cycle, before a new one is starting to fetch(decoded at first/second byte fetched, modr/m etc. Basically whenever something is unknown, decoding happens (takes no cycles, unless known in specific cases, usually at least 1 cycle for any BIU fetch, no matter what it's fetching)). Stuff like modrm decoding takes known cycles. Only documented timings of Reenigne's original emulation project are used, although PIC interrupt handling is just one big EU chunk (besides usual memory accesses).
All instruction timings themselves are mostly as reverse-engineered by Reenigne. Some instructions might have something missing if they're not commonly shared timings with other instructions.
HLT is basically 2 cycles, then 1 cycle until INTR, which will start to read data from RAM, finally followed by some timing for INT (just some NOP EU cycles).

Edit: Just checked INTR timings:
1. Push CS,IP,FLAGS
2. 36 NOP cycles
3. Read CS,IP from IVT.
4. Next instruction starts

That's shared with INT's EU phase of execution (after reading the interrupt number immediate value).

This description has me a bit concerned. Your INTR is a bit backwards; the IVT is read first, FLAGS is pushed, and then CS (FARCALL2), then IP (NEARCALL). Why 36 NOP cycles? There are no NOP cycles in the microcode program for INTR. The timing is mostly driven by the time for bus access and fetching. There are a few cycles spent in the microcode that you would need to account for in addition, but not 36 of them...

Here's the breakdown of my INTR:
1. Execute 1 cycle depending on parameter flag (certain interrupt types will jump past the first microcode instruction of INTR)
2. Execute 2 cycles (calculating the IVR IND)
3. Read IP (taking as many cycles as BIU dictates)
4. Read CS
5. Execute 2 cycles - Suspend prefetching and clear Interrupt and Trap Flags
6. Push FLAGS (taking as many cycles as BIU dictates)
7. Execute 2 cycles - Jump to FARCALL2

FARCALL2:
1. Execute 2 cycles - Correct PC
2. Push CS to stack
3. Execute 3 cycles - jump to NEARCALL

NEARCALL:
1. Execute 3 cycles - FLUSH queue
2. Push IP

so just a rough count that's bus access time + 15 cycles for INTR.

OK. I'll adjust it when I have time to do that.
When does that first cycle apply? I'd assume it's not the fetching from prefetch of the CDxx opcode imm8 parameter?

Author of the UniPCemu emulator.
UniPCemu Git repository
UniPCemu for Android, Windows, PSP, Vita and Switch on itch.io

Reply 53 of 113, by GloriousCow

User metadata
Rank Member
Rank
Member
superfury wrote on 2023-06-19, 21:57:

When does that first cycle apply? I'd assume it's not the fetching from prefetch of the CDxx opcode imm8 parameter?

when executing INT0, INT1, or INT2, the first microcode instruction of INTR is skipped. INT imm8, INTO and INT3 do not skip this instruction. INT3 is a little weird as it skips a microcode slot internally. I'd recommend looking at reenigne's disassembly for the full details.

MartyPC: A cycle-accurate IBM PC/XT emulator | https://github.com/dbalsom/martypc

Reply 54 of 113, by superfury

User metadata
Rank l33t++
Rank
l33t++
GloriousCow wrote on 2023-06-19, 22:59:
superfury wrote on 2023-06-19, 21:57:

When does that first cycle apply? I'd assume it's not the fetching from prefetch of the CDxx opcode imm8 parameter?

when executing INT0, INT1, or INT2, the first microcode instruction of INTR is skipped. INT imm8, INTO and INT3 do not skip this instruction. INT3 is a little weird as it skips a microcode slot internally. I'd recommend looking at reenigne's disassembly for the full details.

What do you mean with INT0/INT1/INT2? Do you mean DIV0 fault, ICEBP(named INT1 alternatively in some documentation), NMI? Because otherwise they don't exist as instructions on a 808X?

Author of the UniPCemu emulator.
UniPCemu Git repository
UniPCemu for Android, Windows, PSP, Vita and Switch on itch.io

Reply 55 of 113, by peterfirefly

User metadata
Rank Newbie
Rank
Newbie

I think it is div0, trace, and NMI.

https://www.righto.com/2023/02/8086-interrupt.html

ICEBP doesn't exist on 8088/8086. Instead, the F1 opcode is an alias for LOCK:

https://www.os2museum.com/wp/undocumented-808 … opcodes-part-i/

On the 286, F1 is a prefix to be used by an ICE for accessing "normal" memory:

https://rep-lodsb.mataroa.blog/blog/intel-286 … e-and-f1-0f-04/

http://www.rcollins.org/ddj/Sep97/

The 386 uses the UMOV instruction for that:

http://www.rcollins.org/secrets/opcodes/UMOV.html

Reply 56 of 113, by GloriousCow

User metadata
Rank Member
Rank
Member
superfury wrote on 2023-06-20, 07:45:

What do you mean with INT0/INT1/INT2? Do you mean DIV0 fault, ICEBP(named INT1 alternatively in some documentation), NMI? Because otherwise they don't exist as instructions on a 808X?

They are the microcode routines behind those, yes. Many routines share common microcode routines for efficiency, so all the microcode routines that do interrupts eventually execute the 'INTR' microcode routine.
I don't know if these names are somewhere in the ROM or patent, or if reenigne took the liberty of naming them, though. You'll find them in his disassembly, in any case.

INT0 for example is not an instruction of course, but is called directly by CORD (division routine) when divide by 0 is detected.

My emulator does not directly execute the microcode, but everything is implemented based on performing the same cycles and control flow as the microcode. If you don't at least take a look at the microcode you'll have a lot of head-scratching places where something somewhere takes a cycle more or less than you'd expect with no seeming explanation, the microcode really explains everything (except BIU delays).

MartyPC: A cycle-accurate IBM PC/XT emulator | https://github.com/dbalsom/martypc

Reply 57 of 113, by reenigne

User metadata
Rank Oldbie
Rank
Oldbie

Other than CORX, CORD and RPTS all the human-readable names in the disassembly were names I made up. The patent does mention a few other names for routines but when there was a conflict between such a name and the normal x86 assembly mnemonic I picked the latter.

Reply 58 of 113, by VileR

User metadata
Rank l33t
Rank
l33t

Been messing around with MartyPC some more and I think I'm getting the hang of things. That will probably merit a little blog post of my own... so far I haven't seen this emulator being shouted from the rooftops as much as it should be - I don't do the social media thing so my rooftop isn't tactically positioned, but I might as well get up there.

GloriousCow wrote on 2023-06-11, 19:27:

The memory viewer doesn't currently support MMIO; since the CGA card owns its own memory which is then mapped into the system and the viewer is not aware of that it shows all 0's. That could be addressed with CGA fairly trivially as it doesn't have pages, but there would be a question for say, EGA/VGA - what should I show for those ranges? Other emulators often have a dropdown for MMIO ranges specifically, and I could follow that model.

Yeah, good question. In a debugger running *on* the emulated machine one would expect to see the contents of the bank that's currently paged into the CPU's address space, no different from emulating an EMS card for instance, but here of course there are more options. I was considering the case of debugging some code with say DS or ES pointing to video RAM, where it can be helpful to just set the memory view to e.g. "DS:0000" or "ES:BX" etc., and see what gets read/written as you single-step.

GloriousCow wrote on 2023-06-11, 19:27:

I've also been considering a dedicated video memory viewer, with options to view VRAM as either hex or various graphical interpretations...

Sounds very nice, although a useful graphical rendering may prove to be a bit of a rabbit hole... you'd probably have to consider arbitrary CRTC settings that change how the data is laid out and interpreted, plus the logical layout of VRAM data can bear little resemblance to the final screen layout, especially on EGA/VGA (where offscreen buffers may be used for tiles/sprites and so on).

But speaking of visual representations: I've always liked the realtime memory usage monitor that some emulators have (e.g. Bisqwit's NES emulator), where you get a map of RAM 'blocks' of arbitrary sizes, and can see read/write ops indicated in color as they happen. MartyPC's memory viewer already has the latter part - think more or less the same thing but at a lower granularity, so you can get a bigger picture of what's going on.
Admittedly that's more of a 'nice to have' toy feature, but if you're patching or reverse-engineering an existing program this sort of thing can actually be helpful.

GloriousCow wrote on 2023-06-11, 19:27:
VileR wrote on 2023-06-11, 17:53:

[*]It'd be awesome if all the debug-related views/widgets could be spun off to a separate window. Especially useful on a two-monitor setup; maybe not so much on a single monitor, so perhaps that could be made an optional setting.

I agree that would be useful. I'm not sure how difficult it will be. The windowing library I'm using does in theory support multiple windows, but I don't know if the wgpu stuff will play nice. I've recently refactored my emulator core into a library so i can support multiple front ends, so if my current library stack won't cooperate I can try to find one better suited for that.

More debugging is coming; register and memory editing for sure (the CPU status window is already a bunch of edit controls, just need to send events when you change them). A breakpoint overhaul is definitely needed. Rather than add a million new little debug windows I'm planning on adding a little quake-like console window where you can issue commands. You'll be able to create named breakpoints of various types, and set up profiling between two breakpoints for cycle counts/time between any two breakpoints you have defined.

I'm a simple man - I get a basic text-based UI for a debugger (or something that acts like one) and I'm good. 😀 A drop-down console window sounds pretty convenient if you want to get rid of separate little widgets; maybe something divided into panes instead?

If you could optionally have it appear as a separate window, all the better... either way, UI takes a back seat to features, so I'd be happy with the above additions however they're presented!

GloriousCow wrote on 2023-06-11, 19:27:

I appreciate you checking it out! Don't hold back on the suggestions. If there's even a remote chance I could make it good enough for people to use it for demo development, that would make me very happy.

Well, down the line it'd be awesome to have more flexible output scaling options, but if you're already planning to offload some rendering tasks to GPU shaders and such, those things would be easier to plug in after that.

You also mentioned the option of letting the GPU handle composite rendering, so perhaps something similar could be done with RGBI, in case someone wants to mimic the IBM 5153's palette treatment and pixel blending. 😀

[ WEB ] - [ BLOG ] - [ TUBE ] - [ CODE ]

Reply 59 of 113, by superfury

User metadata
Rank l33t++
Rank
l33t++

UniPCemu doesn't support memory mapped devices in it's memory viewer (restricted to RAM only). Any memory holes display as being unmapped (greyed out).

It can't display ROMs or VRAM, but I might add some extra feature later to redirect it's viewed addresses to VRAM later (only linearly mapped ofc), since the CPU window itself usually affects the VRAM window state, like VGA latches and ACL registers as well when reads are performed. In essence it's the same as the current memory viewer options for paged/linear direct memory reads, just a flag to redirect to VRAM instead (or ACL register reads, which should be fine afaik). Perhaps a simple submenu using the same method as the first one for those.

Author of the UniPCemu emulator.
UniPCemu Git repository
UniPCemu for Android, Windows, PSP, Vita and Switch on itch.io