Looking on https://github.com/karcherm/486mult it says "Most processors that can run at multiple clock mulitpliers multipliers report a different CPU ID. E.g. an Intel 80486DX4 jumpered for clock doubling instead of clock tripling identifies itself as 80486DX2 instead of 80486DX4.".
I noticed a typo, just checked and my Intel 486DX4-100 SX900 identifies with CPUID 0480 for both x2 + x3. Below I set x2 and set the FSB to 40 MHz.
Given the speed is 80 MHz I could get SIV to guess it was @ x2, but given there are 486DX4-75 I wonder if I should do this.
Looking on https://github.com/karcherm/486mult it says "Most processors that can run at multiple clock mulitpliers multipliers report a different CPU ID. E.g. an Intel 80486DX4 jumpered for clock doubling instead of clock tripling identifies itself as 80486DX2 instead of 80486DX4.".
I noticed a typo, just checked and my Intel 486DX4-100 SX900 identifies with CPUID 0480 for both x2 + x3. Below I set x2 and set the FSB to 40 MHz.
Thanks for the hints, I fixed the README. Furthermore, i pushed a pre-release for version 2.0, which does no longer require masked interrupts, and delivers reliable results in Windows NT. You can execute it with the command line option "/v" (for "verbose") to see raw results, otherwise only the multiplier and (approximate) clock frequency printed. See https://github.com/karcherm/486mult/releases/tag/v1.99 .
otherwise only the multiplier and (approximate) clock frequency printed.
Thank you for the new release, I tried it on my SK096 @ 120 MHz and it seems to have issues. Initially only it was running, it shows the same issues after I had started SIV.
I just tried to run my SK096 @ 80 MHz , 2 x 40 and it's not stable, once in a while I managed to get Windows NT 4.00 SP6a to boot, but it crashed all too quickly. From one BSOD I could see the CPUID was 0483, the same as when it's running @ x3.
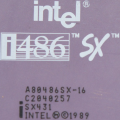
I recently discovered the SK080 this is a DX2 with a 16KB L1 cache and a CPUID of 0480, so basically a DX4 sold as a DX2 !
While I have to correct myself, the tool wasn't yet tested with NT4, but with Windows 2000 instead, I don't think that's the issue with your 120MHz system. Taking a first glance at the raw values, there really is a significantly unexpected pattern in the measurement results: While two out of three values in the "delta values" line are close zero, as expected in a x3 system, the non-zero values should all be approximately the same, but in your case, they are around 240, 480 and then 240 again, that is a "double-height" step for the middle value. I don't yet have an idea what might cause this deviation.
Thanks for testing and reporting back, I will think about the issue, and I will calculate what step height should be expected in a 120*40 system at the cache timing you were operating at. The raw values dumped from my tool are sufficient to calculate the expected step height.
So, the delta values are given in PIT timer ticks. The PIT (8254) runs at 1.193MHz, so each timer tick is 838ns. Every measured time is for 32 executions of 408 loops, i.e. 13056 iterations. Every step is supposed to be the duration of one FSB clock per loop iteration, which is 25ns at 40MHz. So the step height is expected to be 13056*25ns = 326.4µs, which is 390 ticks. This is neither around 240 nor around 480, but somewhere in between.
Also, looking at the step sizes in the other examples, I see widely greater variations than I got reported in a Windows 2000 system. Maybe the virtualized timer in NTVDM is working better in Windows 2000 than it does in Windows NT 4.0. In your 2*33MHz example, the expected step size is 32*259*30ns / 838ns = 297. Your values are mostly above that, that's why the reported clock speed is too low. In the 2*40MHz example, the expected step size is 32*311*25ns / 838ns = 297 again. It's not a bug, but a consequence of the calibration procedure that a change of FSB frequency is not affecting the step height significantly.
For comparison, on an unloaded Windows 2000 system with a 5x86 at 4*40, this result was observed:
1Calibrated to 32x835 iterations
2Timing values: 31137 31155 31937 31938 31920 31952 32728 32749 32743
3Delta values: 18 782 1 -18 32 776 21 -6
488 values rejected due to obvious interruptions
50 measurement processes restarted due to guessed timer overflow
6First full step starts at 1
7Step from 1 to 5
8Detected clock: 4*41MHz -> 164MHz
The expected step height is 32*835*25ns / 838ns = 797, the actual step heights are 782 and 776. The actually observed step heights on a heavily loaded system didn't change much, just the count of "rejected samples" did. These measurements show a significantly better repeatability than the values on your test system, so something is clearly off. Well, hang on... The performance of the measurement loop is expected to be mostly limited by the FSB, and only to a small amount depend on the core clock. The program aims to take around 27ms per measurement, so the number of iterations printed in the first line is an indicator of general memory read performance, especially memory read performance on L1 misses. You get 32*311 at 80MHz and 32*408 at 120MHz. Linearly extrapolating that (which is not the right thing to be, but it tends to yield a result higher than doing a proper estimation), you might get around 32*505 at 160MHz. This is significantly slower than the 780 observed on the Am5x86. Does your system by any chance have more memory than the cacheable area of the L2 cache? In that case, hitting uncached memory interferes with RAM refresh. If I understand your SIV screenshots correctly, the DEC Venturis 4 system has just 128K of L2 cache, but 68 MB of RAM, which typically results in a configuration that is not fully cached, unless that system has an unusually wide tag storage.
So this is another thing I might need to consider for Version 2.0. Possibly I can reproduce your considerable higher jitter on the measurement values by completely disabling L2 cache on my system and disabling "slow DRAM refresh", so interference between DRAM refresh and the measurement algorithm might be visible to me. If it turns out that repeated L2 misses that need to wait for RAM referesh are indeed causing the issue, I might need to find a way to compensate for that as well. I already compensate for the in-ability to CLI on Windows NT by trying to reject all runs of the core timing loop if it looks like the loop was interrupted, and that compensation works quite well. For dealing with DRAM refresh, I might need to better control the pattern on the FSB created by my tool for more uniformity. On the other hand, the core idea of the measurement is to examine different FSB patterns...
I suspect that of NT and later the best option would be to make the program a console WIN32 program, use the QPC for time measurement and bump the priority to at least HIGH_PRIORITY_CLASS, maybe REALTIME_PRIORITY_CLASS
I suspect that of NT and later the best option would be to make the program a console WIN32 program, use the QPC for time measurement and bump the priority to at least HIGH_PRIORITY_CLASS, maybe REALTIME_PRIORITY_CLASS
Currently, I target measurement durations of 27ms, which are split into 32 equal pieces of a sub-millisecond duration. If any of those pieces takes more than 4 microseconds longer than the fastest piece seen yet, it is immediately rejected. This means I automatically reject every interruption that takes at least 4µs. I might decide to make this filter even stricter, but even as it is now, every loss of a time slice will result in that sample being rejected. A higher priority class prevents task switches (which I already detect), but it can't prevent very fast interrupt handlers that do nothing but set a flag to queue a delayed action. Only those fast interrupt handlers are actually able to disturb the measurement, and only a kernel driver would be able to disable interrupts during the measurement. So I don't see that increasing the priority acutally would help with the measurement.
Furthermore, the steps itself have quite consistent timing, even on your system. Take a look at the raw timing value of the first verbose run on the 3*40MHz system:
133280 - end of first step
233489, 33541, 33524 - second step (avg: 33518)
334018, 33992, 34084 - third step (avg: 34031)
434309, 34285 - start of fourth step (avg: 34297)
Each of the steps has values that vary no more than 100 between the lowest and the highest value, which shows a certain repeatability of the measurements. You were able to reproduce that every time on multiple invocations of the tool, yet the step sizes differ way more than 100. Leaving out the end of the first step (as this is only a single number, and thus the least precise one), we observe a jump by 513 from the second to the third step (average values), but just a jump by 266 from the second to the fourth step. The step sizes differ by around 250, which is considerably higher than the span on one step. I don't think you can blame this on the program getting re-scheduled during measurement.
Maybe the virtualized timer in NTVDM is working better in Windows 2000 than it does in Windows NT 4.0.
My main reason for me feeling a WIN32 app would be better for NT and later is it could use the QPC rather than replying on NTVDM to virtualise the PIC. Being able to bump the priority is simply a bonus.
In an NT driver I feel it would be unwise to totally disable interrupts, I would be inclined to do KeRaiseIrql( IPI_LEVEL, &cur); + KeLowerIrql( cur );. I feel HIGH_LEVEL is too high as this would mask out POWER_LEVEL.
I felt I should try x2 again so I tried 2 x 33 and this was OK, 486mult did better. I wonder, is 120 MHz just faster than it expects?
To be honest we still are guessing what has happened on your Intel DX4 at 120 MHz.
It is just because we don't have any Intel DX4 here, neither in &E and nor in &EW flavour. We also haven't tested it on any version of Windows NT but 5.0 (alias Windows 2000) yet.
However, mkarcher said to me that he thinks about a minor change because my Am 5x86 was close to his set borders.
It is likely that his tool will detect the multiplier of Intels DX4 too. We are aware that an Intel DX4 has an optimized architecture that makes it faster than anyone from Cyrix or AMD at same clock frequency (33x3 & 25x3), including Am 5x86 with its 16 kB L1 WB cache at x3. Finally note that we don't consider Cyrix' 5x86 as target CPU of 486MULT since it is downported from a future Pentium class design.
Meanwhile I have played with my 486/160 with 256 MB of RAM (1 read wait, 0 write wait) and 1 MB of L2 cache (2-1-1-1).
My system does not run stable with L2 in write back mode so I had to find a different way to get partially uncached memory. It worked with a tag bit setting of 7+1 in BIOS despite I remained with write through cache.
At least in 486MULT there is a BIG performance drop from cached to partially cached. There is another but minor drop when I disable L2 at all. (Performance NT5: 835 full L2 WT, 333 outside cacheable area, 326 no L2, 955 DOS 6.22)
Since NT kernels try to allocate RAM from top to bottom first, I clearly could feel that performance drop too. This behaviour is different to that from Windows 9x or Linux!
I also like to add that my "heavily loaded" system (250 parallel pings in background) surprisingly did not have much impact but keyboard and mouse actions caused much influence on rejected measurements.
Please may you submit a test of 486MULT /v with disabled L2 cache too?
Perhaps you get a better performance when all of RAM can be cached.
I am bored with Disruptor asking questions and not providing the information I need to sensibly answer them so have muted Disruptor.
Thank you for your edit. Since it looks like the same pattern will be repeated I don't want to comment any longer on your invalid narrative and it does not even fit for the past.
What I'd like to do is to help to improve the tool of my pal mkarcher.
We have considered some TLB issue but since we read in the 486DX manual: "The TLB is a four-way set associative 32-entry page table cache." we have withdrawn this idea. Activated paging in DOS (by using EMM386) does not make a difference. And in both cases we measure 354 speed, L2 off, with & w/o paging (=TLB).
mkarcher is thinking about refresh cycles. Perhaps some (older?) architectures are more concerned than on a "modern" UMC 8886/8881 or SiS 496/497 chipset.
Maybe the virtualized timer in NTVDM is working better in Windows 2000 than it does in Windows NT 4.0.
My main reason for me feeling a WIN32 app would be better for NT and later is it could use the QPC rather than replying on NTVDM to virtualise the PIC.
Disruptor was able to reproduce the irregular timings with L2 disabled in Windows 2000. There is a x4 run with the following results
1Calibrated to 32x326 iterations
2Timing values: 34247 34233 34508 34507 34507 34484 34875 34901 34829
3Delta values: 14 275 -1 0 -23 391 26 -72
4251 values rejected due to obvious interruptions
50 measurement processes restarted due to guessed timer overflow
6First full steps starts at 1
7Step from 1 to 5
8Detected clock: 4*37MHz -> 149MHz
In this case, the first step is 275 ticks, and the secod step is 391 tick, with a difference of 116 ticks, which is very close to the rejection threshold of 128 ticks between the first and second step height. So the issue is clearly reproducable in Windows 2000 if the memory used by 486mult is not fully cached in L2. Timer virtualization can be part of the reason for result quality difference when running the tool in DOS compared to Windows NT, but it likely is not the primary cause for the tool not not work on your DX120 system, while it worked fine on all systems I tested it on (which all had the whole main memory covered by L2).
My tool assumes that an L1 miss can be honered at any time with the same latency. This assumption holds quite well for L2 hits. On the other hand, on L2 misses, the chipset might have to wait for a RAM refresh cycle to finish. Furthermore, the performance strongly depends on whether the 5 pages I access in the timing measurements are in the same DRAM page (allowing all accesses using fast page mode), or there are page misses, so a lot of new unkowns enter the equation.
Trying to get rid of the PIT virtualization might help, but likely not as much as we hope. QueryPerformanceCounter is most likely implemented by reading PIT channel 0 and the kernel-level timer IRQ counter. No matter how you do it (Kernel API call or accessing a virtualized port), aquciring a high-resolution timestamp will involve a context switch to kernel mode and back to user mode, which will push a notable amount of code and data through the cache system. This interferes with the approach I use to get a "clean measurement environment": I do a dummy measurement to make sure L1 (and L2) are hot and then repeat the same measurement again, relying on all my code still being in L1 and the data still being in L2 (the data is purposefully laid out in a way that it can not be cache in L1 to provoke the FSB cycles that enable multiplier detection). This would definitely be a point to perform the measurement from a kernel-level driver, as ZwQueryPerformanceCounter from kernel mode has less overhead than QueryPerformanceCounter from user mode.
But I don't think any of these improvements are really worth it. The code as it is now already clearly identifies the "steps" I look for. On the other hand, expecting that the height of the steps is a direct indication of the FSB clock obviously fails in various circumstances. The key feature of my algorithm is to detect the multiplier, that is the distance of the steps. Detecting the position of the steps clearly works on all systems including your DX120 system, it's just that the height of the steps is unreliable. The height does not enter the multiplier determination at all, so I can drop the consistency check that the steps have equal height. While this also means that the step height obviously isn't a good indicator for the FSB clock in that cases, there is no need to determine the FSB or core clock at the same time. Actually, it doesn't make sense: Everyone already has their own way to determine the 486 core clock way more accurately than my utilitity does, so the approach to measure the core clock the "classic" way and just use my approach to determine the multiplier will report qualitatively better results anyway.
My plan for version 2.0 is:
Find out whether port 42h of the PIT is passed through to hardware without kernel trapping in NT or Windows 2000. If yes, restructure the timing code to only use port 42h access in the "hot part". Currently, ports 42h, 43h and 61h are accessed. Giving userspace I/O permissions to directly access port 43h or 61h would be a recipe to disaster, so those two ports should surely be trapped and virtualized. Port 42h on the other hand can only mess up sound reproduction on the PC speaker.
Try to devise a concept that reduces jitter on the same step. It will clearly help to find out what causes this jitter. Maybe apply stricter filtering. This is to make sure that jitter is not confused with actual steps.
just remove the clock speed calculation
You are free to port the code to 32-Bit NT execution. My point of this code is to show how a BIOS might be able to tell 2*50MHz from 3*33MHz, and having it work well enough in Windows NT / 2000 is just a "bonus feature". The credit you suggested is perfect.
We are aware that an Intel DX4 has an optimized architecture that makes it faster than anyone from Cyrix or AMD at same clock frequency (33x3 & 25x3), including Am 5x86 with its 16 kB L1 WB cache at x3.
Is that a thing? That Intel DX4 is more efficient per-cycle than AMD DX4 (& Am5x86)?
Is that a thing? That Intel DX4 is more efficient per-cycle than AMD DX4 (& Am5x86)?
I'd have to verify it for factual correctness, but there is "common wisdom" that some instructions are executed significantly faster on the Intel DX4 than on the AMD core. IIRC the Intel DX4 core is said to have a faster multiplication unit for integers than the iterated binary multiplication algorithm used by the classic Intel 486 processors, i.e. some kind of "hardware multiplier". The AMD core (up to the 5x86) on the other hand is an (arguably) licensed copy of the classic Intel core. I don't suppose the alledged hardware multiplier has an effect on 486MULT, though. I will keep calling it "alledged" until proven (e.g. by datasheet quotes), because "common wisdom" may be wrong - like the claim that Quake uses the FPU to copy data to video memory, which we recently failed to verify using both the Quake source code and disassembling common Quake executables.
Thank you for the new release, I tried it on my SK096 @ 120 MHz and it seems to have issues. Initially only it was running, it shows the same issues after I had started SIV.
Probably the initial run was hitting L2 cache, and after starting SIV, the tool got pages outside of the cacheable area. Due to your feedback, I adjusted the tool to be less sensitive to disturbances caused by L2 misses. As you already observed, the clock rate reported by my tools was not very accurate, and on that system, it failed a consistency check that should at least ensure a basic accuracy level of clock measurement. So the clock calculation has been removed entirely. It was meant as a bonus anyway, but turned out to be unprecise and unreliable under certain circumstances. Everyone (including you) already has a lot of better methods to measure the 80486 core clock, so to get both the FSB clock and the core clock, use a reliable method (i.e. not my tool) to measure the core clock, and then use the multiplier from my tool to get the FSB clock.
The scope of this tool is to report reliable results all the time in DOS. The key idea is to show an algorithm that could be used by BIOS writers in auto-configuration mode to distinguish 2*50 from 3*33 for processors that do not yet report the multiplier in the CPUID value / DX after reset. It is written in a way that it likely also well in multitasking environments, as long as the handling of timer channel 2 and its interoperation with port 61 is emulated properly, or those bits are passed through to the actual hardware. Tests show good results on both the Windows 95 and Windows 2000 DOS compatibility now, but there might be situations in which the measurement fails.
While this specific code is under a copyleft license, you are free to port the algorithm to a different operating environment, e.g. 32-bit Windows userspace or kernel-space code. The algorithm idea itself is free, so a re-implementation of that algorithm can be used however you want with whatever license you want.
Due to your feedback, I adjusted the tool to be less sensitive to disturbances caused by L2 misses.
Thank you for the new release and for making the L2 miss changes. When I downloaded 486MULT.exe Edge warned me it might be unsafe so I gave feedback to Microsoft saying it is safe. I feel others should do the same, there is also an option for the author/site owner to do this which you could do if you haven't already done so.
The new version reliably reported x3, I then wondered what would happen if a CPU was x2.5 so I tried my POD83 @ 100 MHz, it did not do well, both sets of tests attached.
Pentium don't have an MSR to read the multiplier from so it would be good to use a similar technique as for the 486, do you feel it's possible please? Given P5 and later have a TSC I feel it would be sensible to use it.
That's great news, thank you.
Again, 486MULT had been targeted for 486 class CPUs.
Its target are not Pentium class CPUs like Cyrix 5x86 and of course Pentium Overdrive too. Their technology is too different from 486 architecture.
Pentium don't have an MSR to read the multiplier from so it would be good to use a similar technique as for the 486, do you feel it's possible please? Given P5 and later have a TSC I feel it would be sensible to use it.
This is actually a quite interesting idea: As your test run shows, the Pentium Overdrive also has a visible step, so the idea that you can measure how many internal clocks you have to add until you hit the next external clock might work there as well, although obviously not exactly the same way as on the 486. I see an initial plateau auf 7 samples, which is too wide for 2.5 (or even 5 if two NOPs were paired, but "some sources on the net" claim that the second execution pipeline on the P24T is always disabled). Using the TSC instead of the timer allows for much quicker measurements. I'd expect a different tool might be the best way to implement it, as there are some changes:
You might need to cope with two pipelines on the P5.
You might need a different setup to ensure that the main thing you are observing is the bus fraction.
Furthermore, the P24T may operate at either 1x (fan stopped) or 2.5x (fan working), and there is Intel software to monitor the fan status, so there is no need to measure the multiplier of a P24T, you can just read the fan status bit. Developing a bus clock measurement tool thus won't help you get information you can't already have without it.
There is Intel software to monitor the fan status, so there is no need to measure the multiplier of a P24T, you can just read the fan status bit.
Oh, I did not know there is a fan status bit, is it documented how to read it and if so where please? I wonder what the Intel software reports, where can I get it from?
It's not just the PODs I was considering, I was thinking about doing this for all P5 CPUs.
Last edited by red-ray on 2025-05-25, 15:44. Edited 1 time in total.